The similarities between the flatbed market in 2018, 2021, and this year are hard to ignore, and even though 2021 was driven more by a consumer economy, 2018 and this year do share some similarities. Let’s start with 2018. There were several reasons behind the 2018 flatbed rate rally and capacity crunch:
- There was a substantial uptick in building material shipments in late 2017 following Hurricanes Harvey and Irma driving up flatbed demand in the South Region leading into 2018
- Changes in the corporate tax code in 2018 stimulated spending in the industrial economy, thereby driving up demand for flatbeds,
- The price of crude oil rallied, increasing by 7% in the first half of 2018, creating a lot of activity in fracking and demand for flatbed carriers to haul drill pipe, casing, and related oilfield materials.
When we compare the industrial-driven economy of 2018 to last year, the markets behaved almost identically from a spot rate and volume perspective. Still, the similarities were more the result of the convergence of two entirely different processes at the same time of the year. In 2021 the freight market was upended by the February Polar Vortex event resulting in an acute capacity crunch creating a considerable backlog of activity that needed to get straightened out in March, April, and May. At the same time, we were experiencing a pandemic-driven housing boom resulting in 1.57 million new single-family homes being built in the first half of 2021 compared to the same period in 2020.
Fast-forward to 2022, and we see load-to-truck ratios and spot rates starting to follow the same trendlines as 2018 and 2021. This year we see an uptick in drilling activity due to the surge in oil prices, and according to the latest BakerHughes rig count, there are currently 663 rigs drilling for oil and gas as of the end of February. That’s 248 more than this time last year but still a long way short of the 2,023 rigs in October 2013 at the height of the fracking boom. Steel production in January 2022 was up a couple of percent from January 2021, so more loads for carriers to haul and right on queue, new home building activity always uptick in March. On top of that, retailers are busily stocking up on all things Spring-related, including lumber, roofing and flooring materials, appliances, lawnmowers, and garden tractors. 2022 looks like being another great year for flatbed carriers.
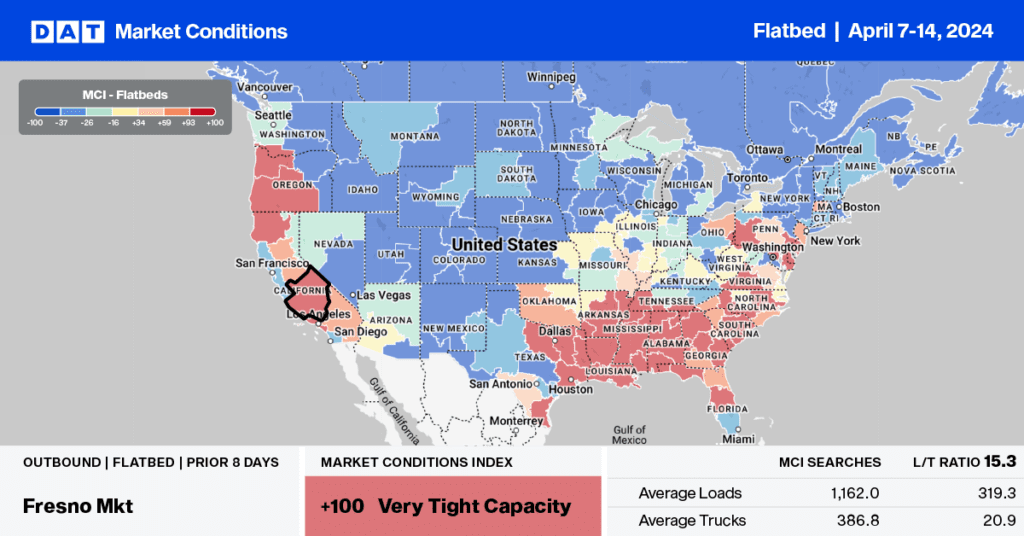
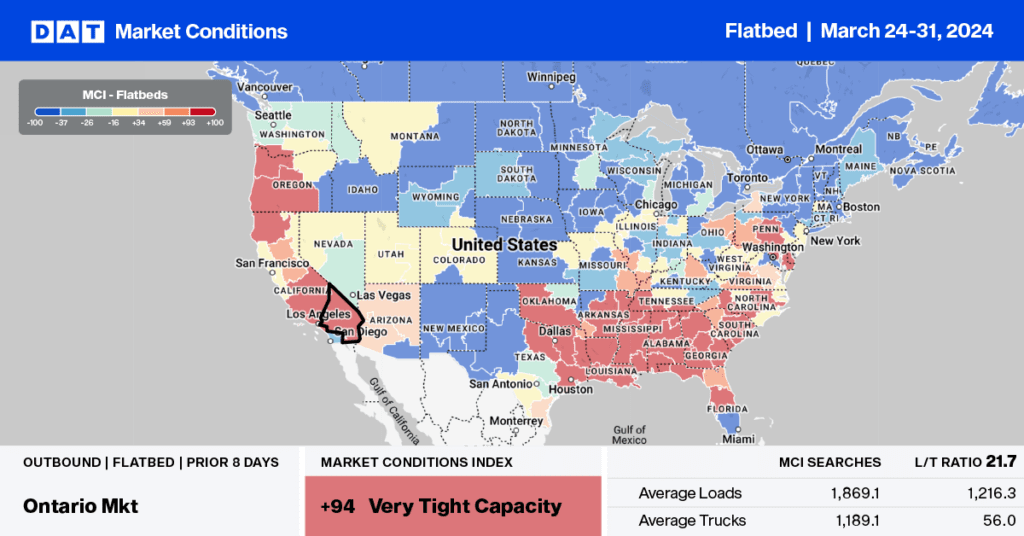
Flatbed capacity tightened again last week San Diego, Los Angeles, and San Francisco markets pushing up spot rates across the region. In San Diego, spot rates increased by $0.14/mile to an average of $3.21/mile excl. FSC, while in the larger Los Angeles market to the north, rates increased by $0.01/mile to $2.84/mile excl. FSC. The San Francisco market recorded the most significant weekly increase, where rates jumped by $0.20/mile to an average outbound rate of $3.20/mile. From San Francisco to Phoenix, loads paid carriers just under $3.00/mile excl. FSC after increasing by $0.03/mile last week. At $2.98/mile, rates on this lane are around $0.70/mile higher y/y.
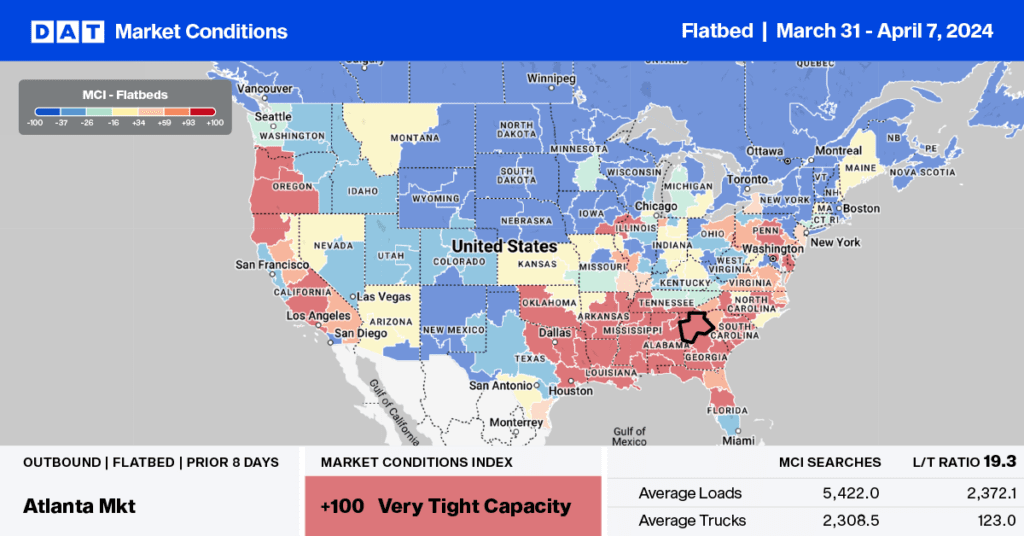
On the 372-mile run from Los Angeles to Phoenix, loads were paying $3.77/mile excl. FSC while capacity loosened on the 700-mile run to Salt Lake City, where rates were averaging $3.21/mile excl. FSC last week, a decrease of $0.29/mile. In Gary, IN, where most finished steel is produced, spot rates jumped by $0.20/mile to an average of $4.05/mile excl. FSC. One of the busier lanes out of Gary is southwest to Kansas City, MO, where rates averaged $4.60/mile excl. FSC last week, up by $0.90/mile in the previous month and by $0.74/mile in the last year.
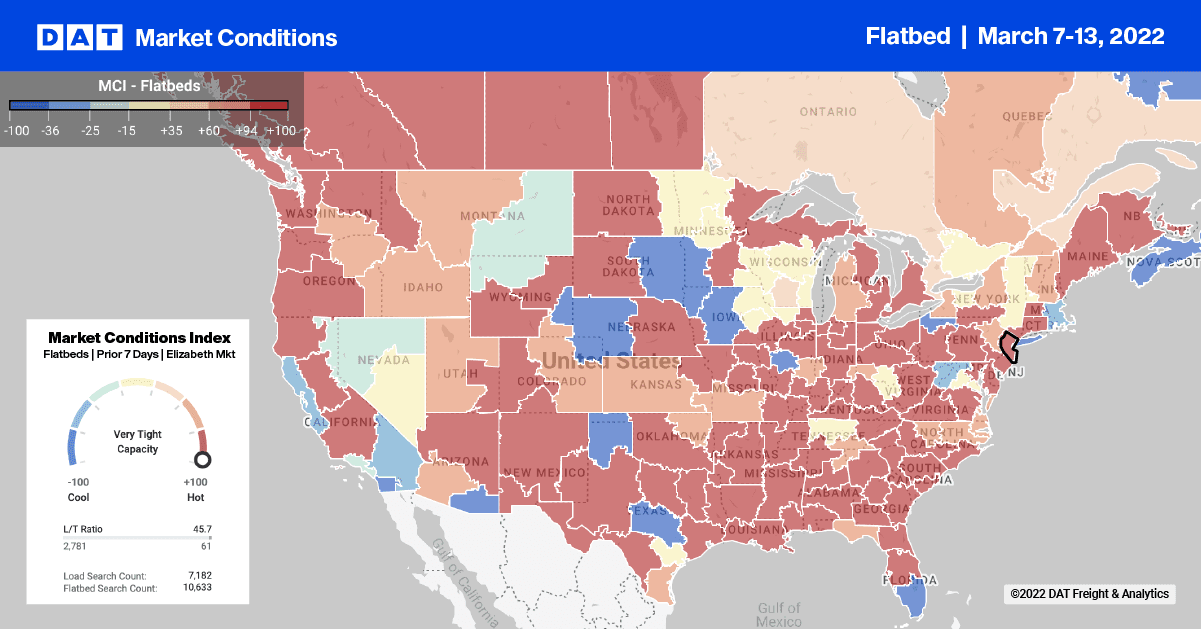
Load-to-Truck Ratio (LTR)
Spring is just a week away. As temperatures rise, so do flatbed load volumes. Last week, the number of loads moving in DAT’s freight network increased by 3% and is now up 7% in the previous month. Load post volumes on DAT’s loadboard have also increased by 18% m/m. Carrier equipment posts reversed course and increased by 12% following declines in the prior four weeks. As a result, the flatbed load-to-truck ratio decreased by 6% w/w from 103.47 to 88.49.
Spot Rates
Flatbed spot rates have been rising for the last three weeks, and following last week’s $0.01/mile increase, the national average flatbed spot rate ended last week at $2.72/mile excl. Spot rates are now up by $0.06/mile in the previous month and $0.28/mile higher than the previous period last year. Compared to the last flatbed bull market in 2018, spot rates are now $0.78/mile higher.