The long-awaited pivot from goods to services may have just occurred, following the 1.3% drop in retail sales in May. According to the U.S. Census Bureau, consumers trimmed expenditure on automobiles, furniture, electronics and building materials as supply chain disruptions have led to longer delays for durable goods products.
In contrast, consumer spending on services increased in May with restaurants and bars recording a 1.8% bump. Building materials and garden supplies were down 5.9% along with furniture sales, which also decreased by 2.1%. Predictably, as consumers got back into circulation, sales of health and personal care goods increased by 1.8% along with clothing sales, which increased by 3%.
Despite the downturn in consumer spending, import volumes continue to pour in from Asia.
According to the last data from the IHS Markit PIERS database, loaded container import volumes were up 22% in the Port of Los Angeles and 14% in the Port of Long Beach. These were the number 1 and number 3 ports respectively for import volumes in May and where the majority of Asian imports are concentrated at the moment. Oakland also saw an increase of 41%.
On the east coast, New York volumes were up 9% this year and 45% since May of last year. Nationally, container import volumes were up 16% and 65% since last May, following record volumes in March and April, normally two of the quietest months on the shipping calendar.
Higher import volumes have no doubt contributed to the record growth we’re seeing in the Cass Freight Index, where shipments in May were up 5.9% and 35.3% since last year. The May result was the second-best result since the index began in 1990, behind only May 2018.
Find loads and trucks on the largest load board network in North America.
Note: All rates exclude fuel unless otherwise noted.
The top 10 markets for van volumes were down by 2% last week, with only two markets posting gains, and there was no surprise which two they were. Following May’s 14% increase in import volumes of containers at the Port of Long Beach and 22% at the Port of Los Angeles (57% of May TEU volume), spot market volumes were up 5% last week in Ontario, CA.
The majority of Ontario’s import containers are transloaded into 53’ vans and intermodal rail units. Capacity also tightened again last week with spot rates moving up $0.03/mile to an average of $3.23/mile in Ontario and by $0.01/mile to $3.10/mile in Los Angeles.
On the 372-mile run from Los Angeles, CA to Phoenix, AZ, spot rates are currently at $4.32/mile, which is $0.30/mile higher than last year’s peak in November and up $1.77/mile since February. That’s still $2.33/mile round-trip mileage rates for carriers turning and burning in Phoenix and not looking for a backhaul.
Dallas, TX to Memphis, TN rates were also up $0.25/mile last week to an average of $2.39/mile — up nearly $1.00/mile since the start of this year. Spot rates to Dallas from Laredo, TX, the number one commercial zone port crossing market, continues to climb. It topped out at $3.18/mile last week — that’s around $0.90/mile higher than the average of most of 2020.
Spot rates
Dry van spot rates remained flat last week compared to the prior week, staying around $2.36/mile last week. Dry van spot rates are still $0.72/mile higher than this time last year and $0.33/mile higher than the same week in 2018.
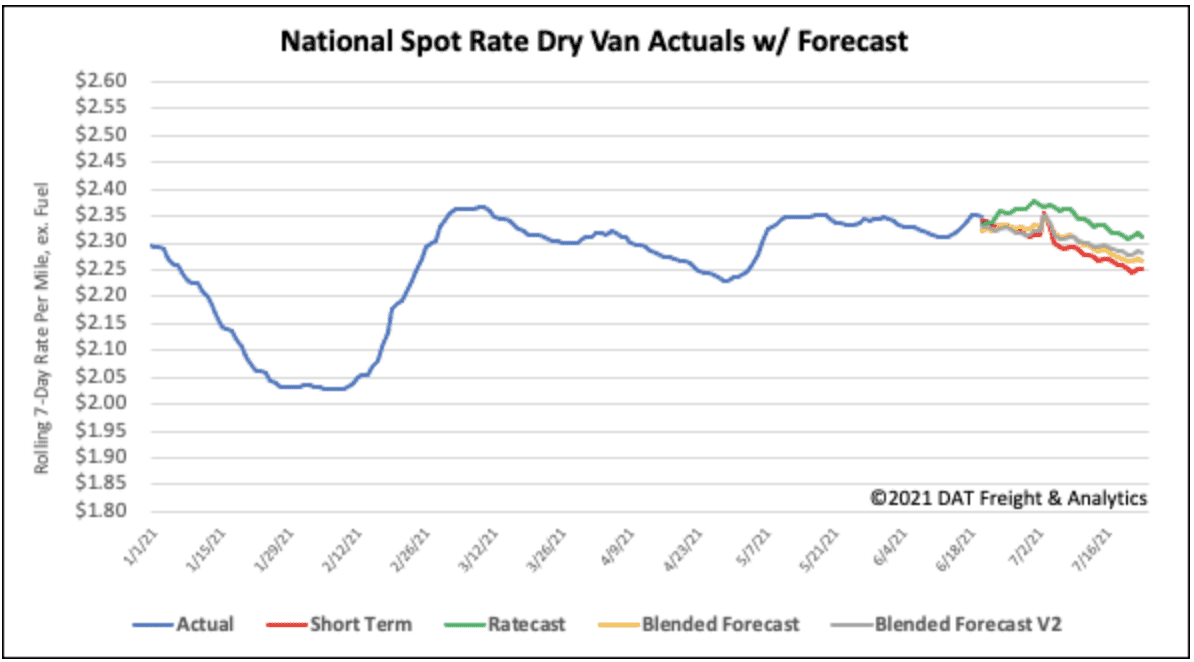
How to interpret the rate forecast:
- Ratecast: DAT’s core forecasting model
- Short Term Scenario: Formerly the pessimistic model that focuses on a more near-term historical dataset
- Blended Scenario: More heavily weighted towards the longer-term models
- Blended Scenario v2: More heavily weighted towards the shorter-term models