Over the past 12 months, we’ve seen consumers spend more on outdoor activities including exercise and sporting equipment, snowmobiles, and furniture to name just a few.
Following this trend has been sales of farm tractors of less than 40 horsepower, which have been on the rise for almost 12 straight months. In February, sales of 11,011 units represented a 47% year-over-year increase, according to the latest data from Curt Blades, Senior Vice President of Ag Services at the Association of Equipment Manufacturers (AEM).
Sales of the larger 100+ horsepower two-wheel drive farm tractors increased by 46% y/y ,with sales of just over 1,100 units. Sales in the self-propelled combine harvester category fell by 19% y/y.
“This growth streak has been going in the U.S. since April, and in Canada since June,” said Blades. “However, we’re closely watching the bigger units, which are more dependent on the strong commodity prices we’re experiencing right now, to see if this trend continues.”
Year-to-date sales of combines are up 24%, as are sales in all other farm tractor categories, which is great news for those in the flatbed, specialized and over-dimensional sectors.
Find loads and trucks on the largest load board network in North America.
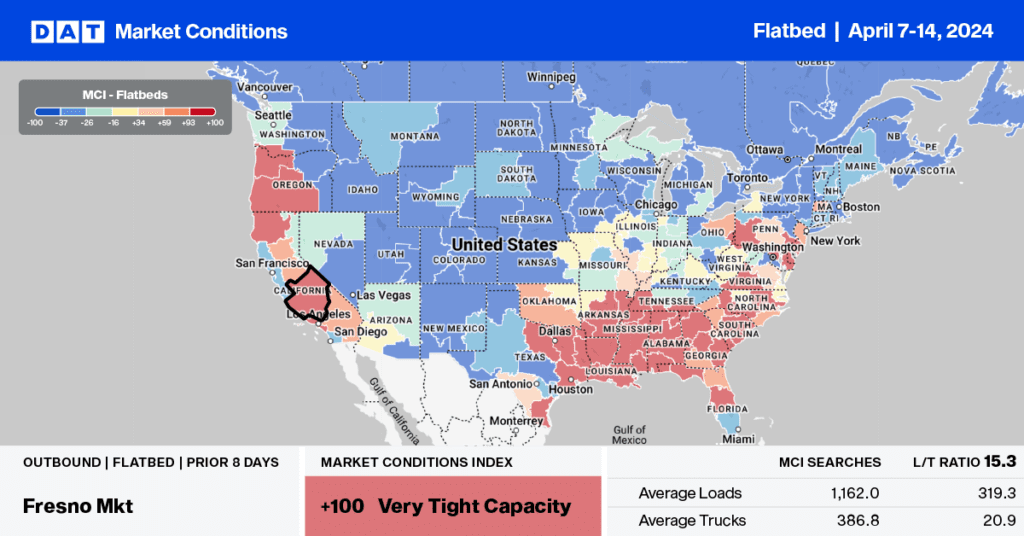
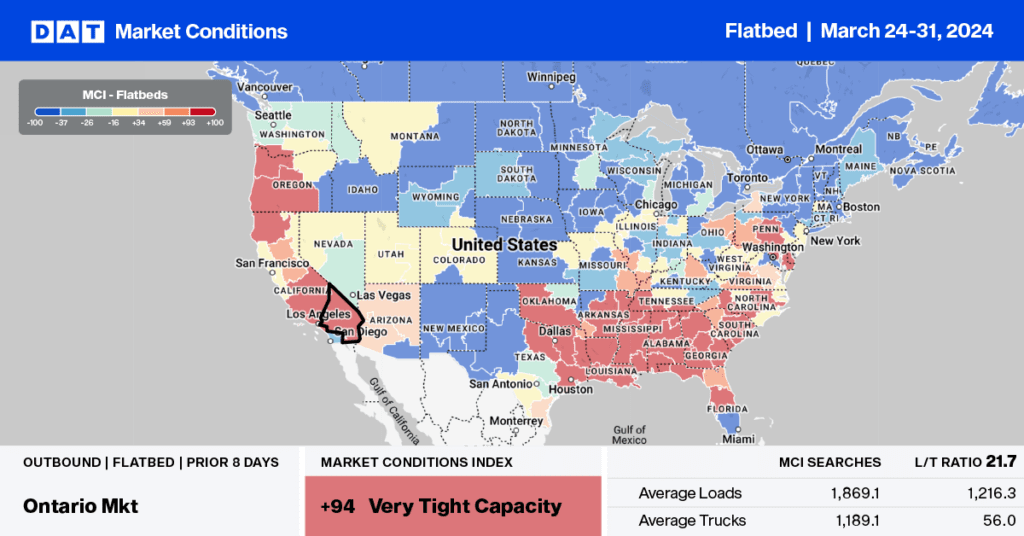
Even though there was very little change in flatbed volumes last week, available capacity continues to tighten. Spot rates reached an average of $3.28/mile, excluding fuel, in the top 10 markets — up $0.18/mile last week.
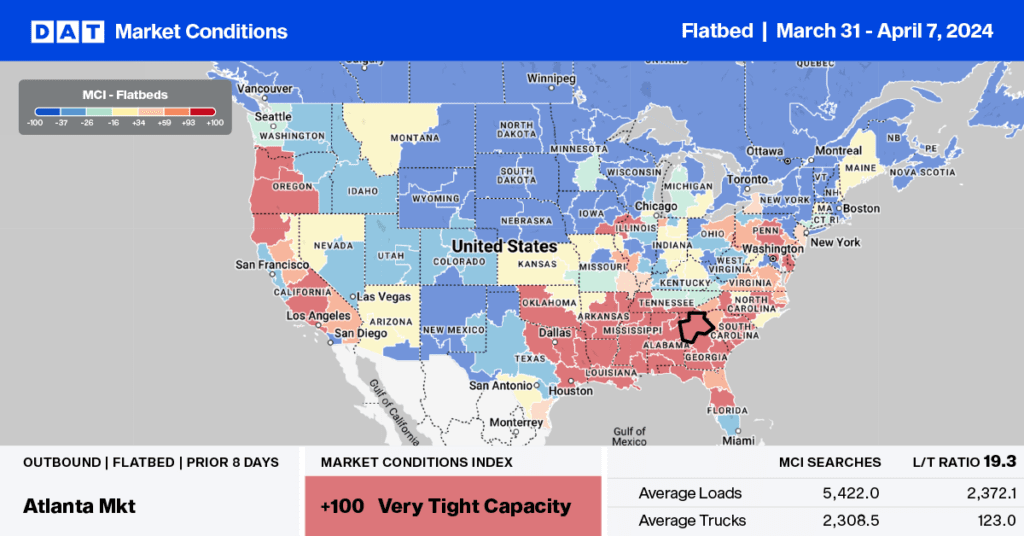
Outbound volumes surged in Charlotte, increasing by 28% last week. Spot rates also increased $0.08/mile to $3.11/mile, excluding fuel.
Capacity was also tight in Memphis, where rates increased $0.11/mile to $3.33/mile on 12% lower volumes. Farther west in St Louis, capacity was flat even though volumes increased by 16% w/w.
Spot rates forecasts
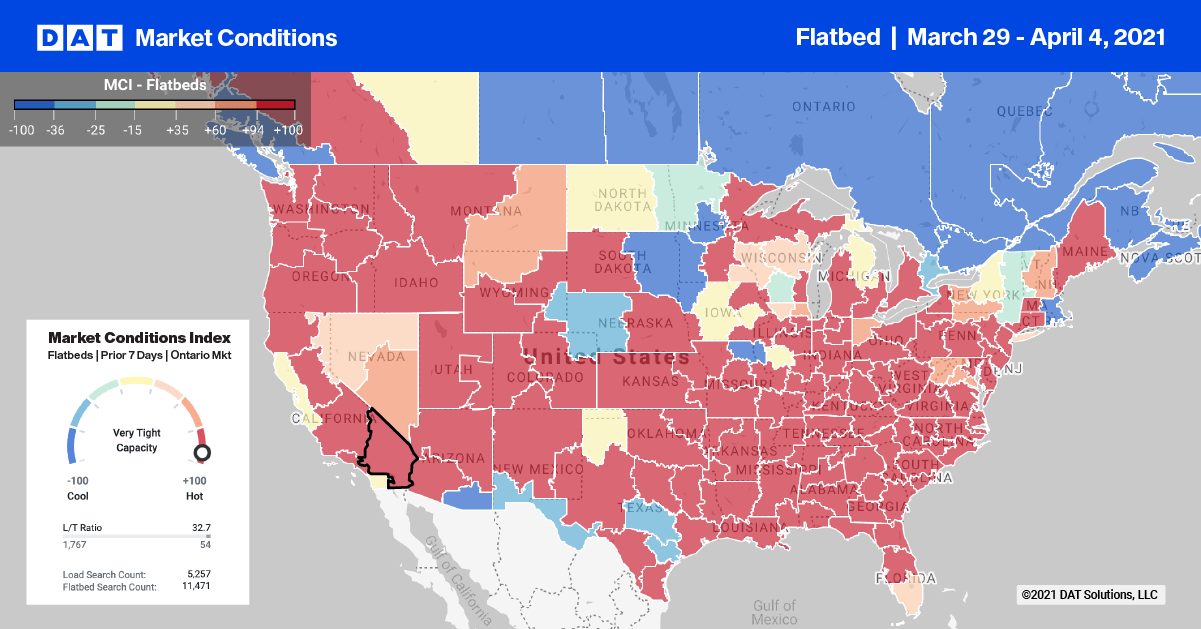
The national average flatbed rate increased again for the ninth week in a row. The average rose $0.05/mile to $2.49/mile, excluding fuel surcharges, which is $0.59/mile higher than the same week in 2020.
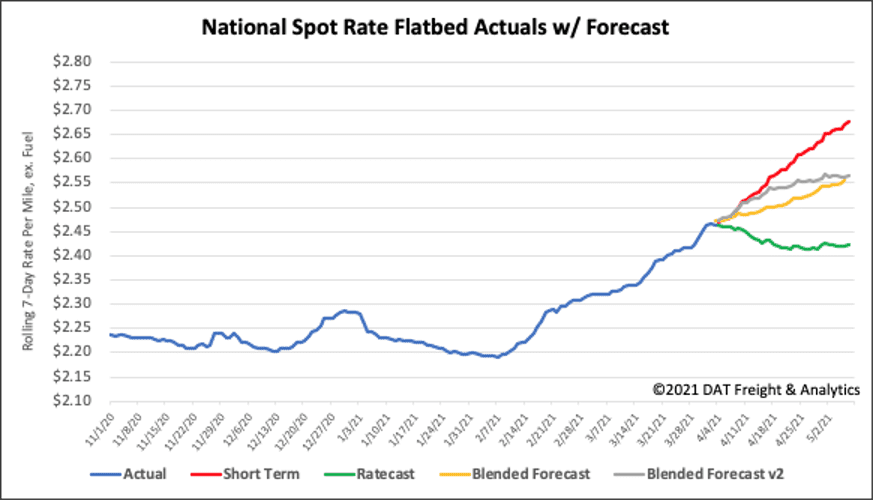
How to interpret the rate forecast:
- Ratecast: DAT’s core forecasting model
- Short Term Scenario: Formerly the pessimistic model that focuses on a more near-term historical dataset.
- Blended Scenario: More heavily weighted towards the longer-term models.
- Blended Scenario v2: More heavily weighted towards the shorter-term models.