PORTLAND, Ore. — This summer’s spot market rates were the highest since 2015, and freight availability is approaching levels not seen since 2014, a banner year, according to DAT Solutions, which operates North America’s largest truckload freight marketplace.
August continued the trend with a 6.4 percent increase in load volume. At the end of the month, Hurricanes Harvey and Irma — and, to a lesser degree, wildfires in California, Oregon, Washington, and Montana — destroyed lives and property, and caused massive supply chain disruptions. As emergency relief efforts began, the additional pressures on capacity led to truck shortages in freight markets all over the country.
As a result, spot truckload rates rose sharply in the first week of September. “We see rates remaining elevated through the holiday freight season, which now runs from October through December, particularly when relief efforts and supply chain disruptions are ongoing,” said Mark Montague, DAT industry pricing analyst.
Even before the first storm made landfall, the number of available van loads jumped 15 percent and refrigerated (“reefer”) increased 23 percent, compared to July The national average rates for both trailer types were 1 cent higher, rising to $1.79 per mile for vans and $2.08 per mile for reefers.
The number of available flatbed loads declined 5.4 percent in August, a typical seasonal trend that is expected to reverse in September. The national average flatbed rate rose 1 cent to $2.18 per mile on the spot market.
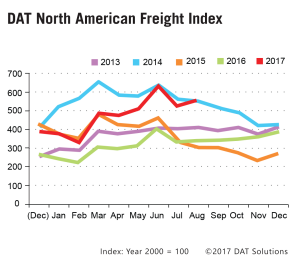
Established in 1978, DAT operates a network of load boards serving intermediaries and carriers across North America. For more than a decade DAT has published its Freight Index, which is representative of the dynamic spot market.
Reference rates are the averages, by equipment type, based on $33 billion of actual transactions between freight brokers and carriers, as recorded in DAT RateView. Reference rates per mile include fuel surcharges, but not accessorials or other fees. Beginning in January 2015, the DAT Freight Index was rebased so that 100 on the Index represents the average monthly volume in the year 2000. Additional trends and analysis are available at DAT Trendlines.