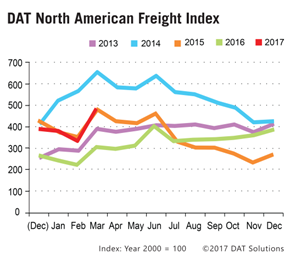
PORTLAND, Ore. —The DAT North American Freight Index climbed 47 percent in March, the first month-over-month increase of the year as shippers ramped up freight activity, reported DAT Solutions, which operates the industry’s largest on-demand freight exchange.
 Spot truckload rates responded with only modest gains, however. The national average spot rates for van and refrigerated (“reefer”) freight added just 1 cent to $1.63 per mile and $1.87 per mile respectively, compared to February, including average fuel surcharges.
“Rates rose in the last week of March, as shippers rushed freight out to end the quarter on a high note, but that was not enough to offset soft market conditions from early March,” Don Thornton, Senior Vice President, DAT explained.
Demand for trucking services in construction and energy was particularly strong for spot flatbed freight.
Flatbed load posts rose 45 percent while truck posts increased 6 percent compared to February. That pushed the flatbed load-to-truck (L/T) ratio up 38 percent to 36.6, meaning there were 36.6 available flatbed loads for each truck on the DAT network, which is a 109% gain over March 2016. A flatbed load-to-truck ratio of 18 is considered very favorable for carriers, and the average flatbed rate gained 6 cents to $2.03 per mile.
Van load posts increased 47 percent and truck posts rose 13 percent in March compared to February, for a national average van load-to-truck ratio of 3.2, which is below the 5.5 L/T ratio favoring carriers. Likewise, reefer loads jumped 49 percent and truck posts increased 14 percent for load-to-truck ratio of 6.2. A L/T ratio of 12 is considered extremely favorable to refrigerated carriers.
Rates continued to rise in the first week of April, however, signaling a strong start to the second quarter.
Established in 1978, DAT operates a network of load boards serving intermediaries and carriers across North America. For more than a decade DAT has published its Freight Index, which is representative of the dynamic spot market.
Reference rates are the averages, by equipment type, based on $33 billion of actual transactions between freight brokers and carriers, as recorded in DAT RateView. Beginning in January 2015, the DAT Freight Index was rebased so that 100 on the Index represents the average monthly volume in the year 2000. Additional trends and analysis are available at DAT Trendlines.