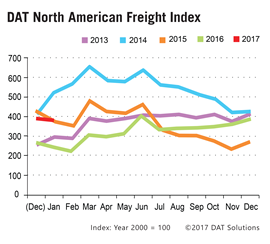
PORTLAND, Ore., —The DAT North American Freight Index edged downward in January as spot truckload freight settled into a typical post-holiday pattern, albeit at significantly elevated levels compared to this time last year.
 The Freight Index dropped 2.5 percent in January compared to an exceptionally strong December and was 56 percent higher year over year, said DAT Solutions, which operates the industry’s largest on-demand freight exchange for spot freight.
Spot van, refrigerated, and flatbed rates in January were higher year over year, but an influx of capacity from contract carriers onto the spot market, particularly on high-traffic lanes, depressed rates compared to December.
“Coming off a high in December, January was still very solid for spot freight,” said Don Thornton, Senior Vice President at DAT. “As a result we saw more contract carriers make their trucks available on load boards, and the added capacity contributed to lower rates on many high-traffic lanes.”
Falling Down from a High
Compared to December, the volume of van freight on the spot market was down 9 percent last month but up 63 percent year over year. The national average rate for vans was $1.68 per mile including a fuel surcharge, down 5 cents compared to December but up 2 cents year over year.
Refrigerated freight followed a similar trend. The number of available loads fell 8 percent in January but was 57 percent higher year over year. Available capacity rose 1 percent.
The national average spot rate for refrigerated freight was $1.96 per mile including a fuel surcharge, 3 cents lower than December but 6 cents higher compared to January 2016.
Demand for flatbed trucks rose 18 percent compared to December and 64 percent year over year. Available capacity rose just 3 percent.
At $1.91 per mile, the national average flatbed rate was 5 cents lower compared to December but was 3 cents higher year over year.
Established in 1978, DAT operates a network of load boards serving intermediaries and carriers across North America. For more than a decade DAT has published its Freight Index, which is representative of the dynamic spot market.
Reference rates are the averages, by equipment type, based on $33 billion of actual transactions between freight brokers and carriers, as benchmarked in DAT RateView. Rates are cited for line-haul only, except where noted. Beginning in January 2015, the DAT Freight Index was rebased so that 100 on the Index represents the average monthly volume in the year 2000. Additional trends and analysis are available at DAT Trendlines.