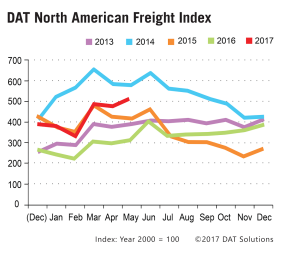
PORTLAND, Ore. – The DAT North American Freight Index fell 2.5 percent in April but volume remained above seasonal norms, signaling a solid start to the second quarter of 2017, reported DAT Solutions, which operates the industry’s largest on-demand exchange for spot truckload freight. Freight volumes increased 60 percent compared to April 2016.
 Average spot truckload rates rose last month for vans, refrigerated (“reefer”), and flatbed freight, on both a month-over-month and year-over-year basis.
“It’s not unusual for truckload freight activity to give ground in April, but national average load-to-truck ratios and rates last month were higher than expected,” said Mark Montague, DAT industry pricing analyst.
While van demand declined 4.5 percent compared to March, the national average load-to-truck ratio was up 8 percent month over month, and rose 127 percent year over year. The load-to-truck ratio measures the number of available loads for each truck posted on the DAT Network of load boards, and is an indicator of the balance between capacity and demand for freight services. That balance favored carriers in April, as indicated by an increase in the national average spot rate of $1.67 per mile for vans, up 4 cents compared to March and up 17 cents compared to April 2016, including fuel surcharges.
The spot reefer freight market experienced a similar trend. Reefer demand declined 5.4 percent compared to March, but demand was 87 percent higher year over year. The load-to-truck ratio rose for reefers, and so did truckload rates. At $1.94 per mile, the average spot reefer rate was 7 cents higher compared to March and 14 cents higher year over year.
In the flatbed segment, the national average rate increased 4 cents to $2.07 per mile compared to March and was 17 cents higher year over year. Flatbed demand has been robust, and load-to-truck ratios are elevated, in 2017 to-date, but freight volume was unchanged (down 0.3 percent) compared to March, and up 43 percent compared to April 2016. Flatbed demand typically peaks in May and June, so demand could continue to increase this year, Montague said.
Established in 1978, DAT operates a network of load boards serving intermediaries and carriers across North America. For more than a decade DAT has published its Freight Index, which is representative of the dynamic spot market.
Reference rates are the averages, by equipment type, based on $33 billion of actual transactions between freight brokers and carriers, as recorded in DAT RateView. Reference rates per mile include fuel surcharges, but not accessorials or other fees. Beginning in January 2015, the DAT Freight Index was rebased so that 100 on the Index represents the average monthly volume in the year 2000. Additional trends and analysis are available at DAT Trendlines.