PORTLAND, Ore., February 13, 2026 — Truckload freight volumes declined in January following the holiday shipping season, while spot market rates continued to build on December gains, reported DAT Freight & Analytics, provider of the industry’s leading load boards and freight analytics.
The DAT Truckload Volume Index (TVI), which measures demand for truckload services, declined month over month for van and refrigerated (“reefer”) loads, reflecting a post-holiday slowdown in retail and food shipments:
- Van TVI: 219, down 4% compared to December
- Reefer TVI: 184, down 4%
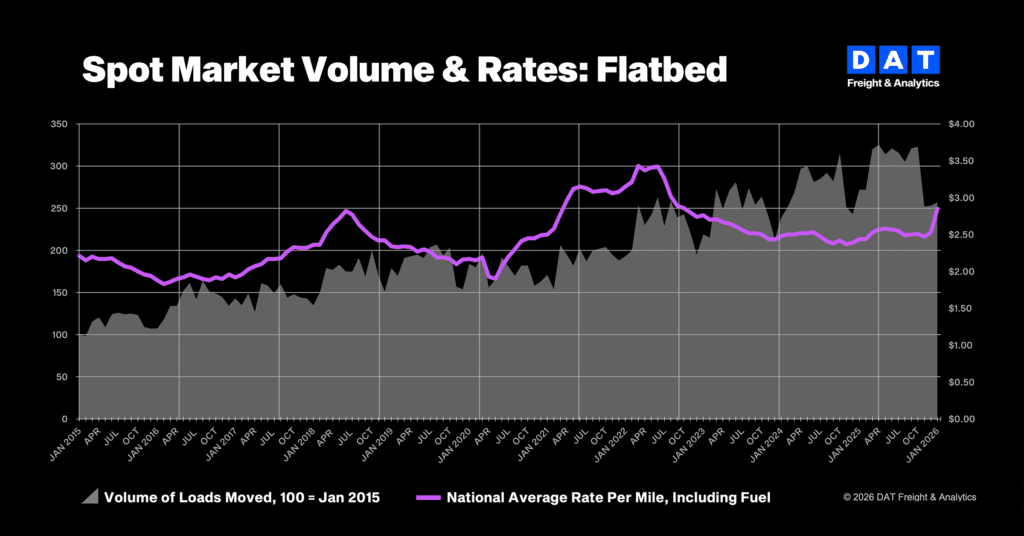
- Flatbed TVI: 257, up 2%
Spot pricing: Strong start to the year
Despite softer freight volumes, average spot rates increased in January, particularly for refrigerated and flatbed loads.
- Spot van rate: $2.32 per mile, up 3 cents from December
- Spot reefer rate: $2.81 per mile, up 12 cents
- Spot flatbed rate: $2.85 per mile, up 22 cents
Strong gains in flatbed freight signaled continued demand for specialized equipment to move construction and industrial materials, especially in challenging winter conditions. Winter Storm Fern disrupted transportation networks generally, sidelining truckload capacity and reducing supply chain productivity across 24 states. Tighter effective capacity helped boost spot-market pricing despite lower truckload volumes.
Year over year, spot rates continued to track higher. The average spot van rate was up 17 cents from January 2025, while the reefer rate was up 27 cents. Spot flatbed rates increased 41 cents year over year.
Contract rates: Stable in January
- Contract van rate: $2.48 per mile, up 2 cents month over month
- Contract reefer rate: $2.81 per mile, up 2 cents
- Contract flatbed rate: $3.04 per mile, down 1 cent
“Not every spike or dip warrants a response,” said Ken Adamo, chief of analytics at DAT. “What matters is whether the data signals a temporary disruption or a real shift in market fundamentals. January’s numbers didn’t mark a change in loads moved, but they did show how shipper urgency and carrier pricing discipline can push rates up despite softer volumes.”
About the Truckload Volume Index
The DAT Truckload Volume Index measures monthly changes in loads with a pickup date during that month. A baseline of 100 equals the number of loads moved in January 2015, based on data from DAT RateView, part of the DAT iQ freight analytics platform, which tracks rates paid on approximately 3 million loads per month. Benchmark spot rates reflect invoice data for hauls of 250 miles or more, offering a consistent view of truckload demand and spot rate trends across the United States and Canada.