PORTLAND, Ore.,—Truckload volume surged and spot and contract freight rates hit new highs in August as logistics managers stare down their most challenging peak shipping season yet.
The DAT Truckload Volume Index (TVI) rose to 231 last month, up 2% from July and 17% higher year over year. The Index is an aggregated measure of dry van, refrigerated (“reefer”) and flatbed loads moved by truckload carriers and an industry standard indicator of commercial freight activity. A baseline of 100 reflects freight volume in January 2015.
“Shippers and logistics managers who would normally be gearing up for peak shipping season have encountered one test after another in terms of their ability to manage transportation pricing, capacity and supply chain disruptions,” said Ken Adamo, Chief of Analytics at DAT Freight & Analytics. “There’s no easy path through this freight environment.”
Spot van, reefer rates set records
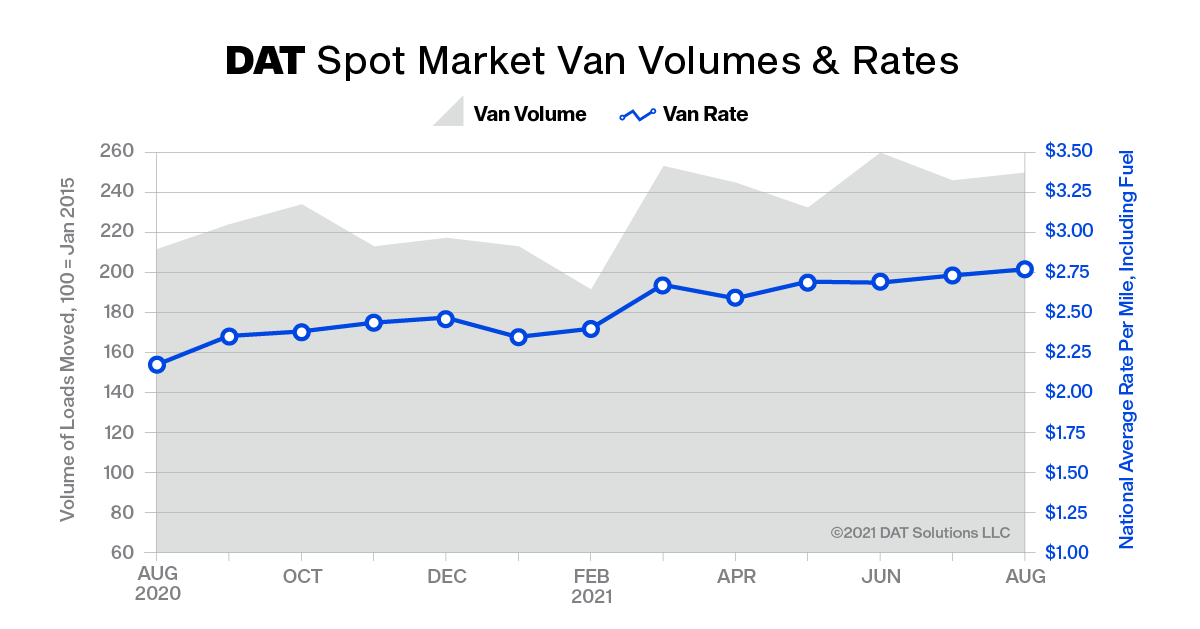
- The national average rate for van loads on the DAT One load board network rose 3 cents to $2.76 per mile (including fuel surcharge) in August, surpassing the previous high in July. The monthly average spot van rate has increased 40 cents since January and 72 cents year over year.
- Refrigerated and flatbed spot rates topped $3 a mile as a national average for the fourth consecutive month. The reefer rate was $3.15 per mile, up 1 cent compared to July. The flatbed rate averaged $3.08 a mile, a 4-cent decline with demand tapering off seasonally.
Spot load postings increased 12%
- The number of loads posted to the DAT network jumped 11.9% in August while truck posts rose 1.5%, pushing van and reefer load-to-truck ratios higher. The national average van load-to-truck ratio was 6.5, meaning there were 6.5 available loads for every van posted to the DAT network, up from 5.8 in July. A change in the ratio signals a shift in pricing.
- The reefer load-to-truck ratio increased from 12.6 to 14.9 driven by late-summer harvests and grocery stocking ahead of Labor Day. The flatbed ratio was 44.1, virtually unchanged from July as construction, agriculture, energy and other flatbed-intensive industries experienced seasonal declines.
Contract rates, fuel prices rise
- Contract rates for all three equipment types increased month over month. The national average contract van rate was $2.81 per mile, up 5 cents compared to July, while the reefer rate was $2.94 per mile, a 4-cent gain. The average contract rate for flatbed freight inched 1 cent higher to $3.30 per mile.
- The national average price of on-highway diesel was $3.35 a gallon in August, the highest since October 2018. At 35 cents per mile for van freight, the average fuel surcharge was unchanged compared to July but 15 cents higher year over year.
About the DAT Truckload Volume Index
The DAT Truckload Volume Index reflects the change in the number of loads with a pickup date during that month; the actual index number is normalized each month to accommodate any new data sources without distortion. Baseline of 100 equals the number of loads moved in January 2015, as recorded in DAT RateView, a database of rates paid on an average of 3 million loads per month. DAT national average spot rates are derived from RateView and include only over-the-road lanes with lengths of haul of 250 miles or more. Spot rates represent the payments made to carriers by freight brokers, third-party logistics providers and other transportation buyers.