BEAVERTON, Ore., November 18, 2025 — Truckload freight volumes declined for the fourth consecutive month in October, casting a long, cool shadow on shipping activity for holiday retail goods, said DAT Freight & Analytics, which operates the DAT One freight marketplace and DAT iQ data analytics service.
For the first time in 2025, the DAT Truckload Volume Index (TVI), a key indicator of truckload freight demand, for all three equipment types was lower on both a month-over-month and year-over-year basis:
- Van TVI: 232, down 3% compared to September and 11% year over year
- Refrigerated TVI: 184, down 2% month over month and 7% year over year
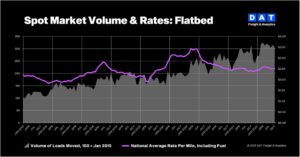
- Flatbed TVI: 305, down 4% month over month and 3% year over year
“Freight volumes in the third quarter and October reflect what we’re seeing in the broader goods economy, with shippers drawing on inventory built up earlier in the year to reduce their exposure to tariffs and weak consumer demand,” said Ken Adamo, DAT Chief of Analytics. “As a result, the latest readings from the Truckload Volume Index show the traditional peak holiday shipping season looks virtually non-existent this year.”
Rates edged higher
While truckload freight volumes continued to slip, tighter capacity nudged rates upward. National average spot rates rose for all three equipment types in October:
- Spot van: $2.07 per mile, up 2 cents from September
- Spot reefer: $2.48 per mile, up 4 cents
- Spot flatbed: $2.51 per mile, up 1 cent
Spot rates were higher than in October 2024, when the van rate averaged $2.02 per mile, the reefer rate $2.39, and the flatbed rate $2.42.
Contract rates showed little change compared to September:
- Contract van: $2.42 per mile, unchanged for the third straight month
- Contract reefer: $2.78 per mile, up 2 cents
- Contract flatbed: $3.09 per mile, up 3 cents
Still a buyer’s market
While dry van rates on new contracts are averaging 1 to 2% less than the rates they are replacing, new contract rates for temperature-controlled freight are beginning to rise, noted Dr. Chris Caplice, DAT Chief Scientist.
“While it’s a buyer’s market for truckload transportation, it’s also buyer beware,” Caplice said. “Polling of shippers in our DAT iQ Benchmark consortium shows they’re prioritizing reliable capacity over securing minor cost savings on new contracts. Carrier survivability and overall viability are becoming growing concerns.”
About the Truckload Volume Index
The DAT Truckload Volume Index is widely used across the industry to track monthly changes in truckload activity, reflecting the change in the number of loads with a pickup date during that month. A baseline of 100 equals the number of loads moved in January 2015, as recorded in DAT RateView, a database tracking rates paid on an average of 3 million loads per month. Because the TVI provides a consistent measure of freight movement, DAT benchmark spot rates are derived from invoice data for hauls of 250 miles or more with a pickup date during the month reported.