DENVER, Colo., July 25, 2022—Truckload freight volumes remained strong in June while pricing on the spot market was weighed down by a growing supply of available capacity, said DAT Freight & Analytics, operators of the DAT One truckload freight marketplace and DAT iQ data analytics service.
DAT’s June Truckload Volume Index (TVI) for dry van freight was 240, up 6% compared to May; the refrigerated TVI was 173, down 0.6%; and the flatbed TVI was 245, up 5% month over month. Changes in the TVI reflect the number of loads moved with a pickup date during last month.
Contract van, flatbed rates hit monthly highs
The national average price to move van and flatbed freight under contract each hit monthly highs. The van rate rose 1 cent to $3.29 per mile while the flatbed rate increased 3 cents to $3.90 a mile. The contract reefer rate was $3.56 a mile, unchanged from May.
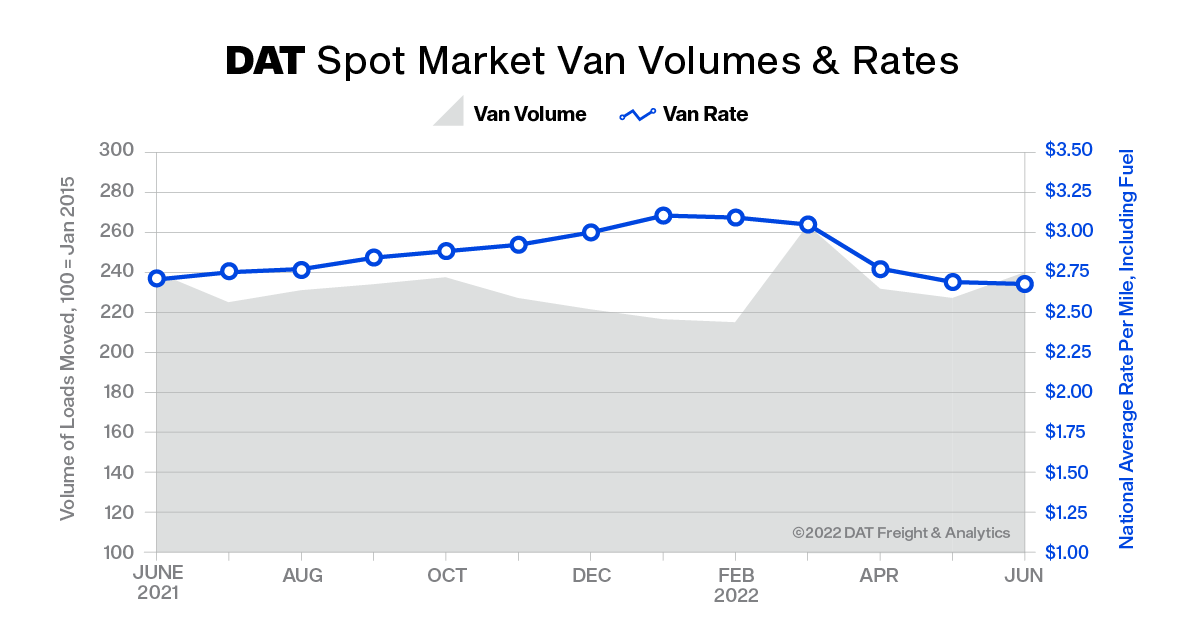
On the spot market, the national average van rate fell to $2.68 per mile, down 1 cent compared to May, while the spot reefer rate was $3.04 per mile, down 2 cents. The flatbed rate averaged $3.46 per mile, up 2 cents month over month and a new record.
Spot rates are negotiated by the carrier and freight broker as one-time transactions and should incorporate an amount to help cover the carrier’s fuel expense based on diesel prices at the time. Surcharges in June averaged 75 cents a mile for van freight, 82 cents a mile for reefers and 90 cents a mile for flatbed freight, all record highs. Removing an amount equal to an average fuel surcharge, the spot van line-haul rate was $1.93 a mile, the reefer rate was $2.22 a mile and the flatbed rate was $2.56 a mile.
Year over year, the average spot van was unchanged, the reefer rate was down 6 cents and the flatbed rate was up 31 cents. However, fuel cost $3.29 a gallon as a national average in June 2021 compared to $5.75 last month.
Capacity on the spot market outpaced demand
The number of loads posted to the DAT One load board network declined 20% compared to May and fell 26% year over year. Capacity outpaced demand, with 7% more trucks on the network compared to May.
The national average van load-to-truck ratio fell from 4.4 in May to 3.9, meaning there were 3.9 available loads for every van on the DAT network. The reefer load-to-truck ratio was 7.0, down from 7.5. The flatbed ratio dropped from 63.3 to 37.6.
No freight recession in Q2
“Downward pressure on spot rates in June was driven by a combination of high fuel prices and a record number of trucks available for work,” said Ken Adamo, DAT’s Chief of Analytics. “While small trucking companies and independent operators are exiting the market, it’s not for a lack of freight. Overall truckload volumes were strong in June as they were throughout the second quarter and now into the first half of July.”
For more information about DAT iQ, go to dat.com/iQ.
About the DAT Truckload Volume Index
The DAT Truckload Volume Index is produced by DAT iQ and reflects the change in the number of van, refrigerated and flatbed loads moved under contract and the spot market with a pickup date during that month. Index numbers are normalized each month to accommodate any new data sources without distortion. Baseline of 100 equals the number of loads moved in January 2015.
Rates are derived from RateView, DAT’s database of $137 billion in annualized freight transactions, and include over-the-road lanes with lengths of haul of 250 miles or more. Spot rates represent the payments made to carriers by freight brokers, third-party logistics providers and other transportation buyers. Contract rates are paid by the shipper to the carrier.