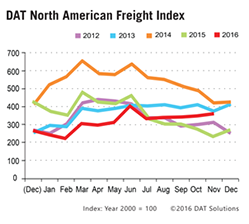
PORTLAND, Ore.—A sharp increase in e-commerce traffic and refrigerated produce is extending the busy holiday season for truckload carriers, as the availability of spot truckload freight gained in November on both a month-over-month and year-over-year basis, according to the DAT North American Freight Index.
The November Freight Index reflects a continued pattern of unseasonably strong freight volumes starting in July. Load-to-truck ratios increased significantly for van, refrigerated (“reefer”), and flatbed freight last month, meaning there were more available loads for each truck posted on the DAT Network of load boards. A change in the ratio is typically followed by a change in freight rates.
Surging Freight Availability
The availability of van freight on the spot market surged in November, up 4.9 percent over October and up 63 percent compared to November 2015. At $1.46 per mile, the national average van line haul rate increased 3 cents (2.1 percent) compared to October, followed by further rate increases during the first week of December on the strength of traffic from Memphis, Denver, and other hubs for e-commerce and parcel freight.
 Reefer freight availability increased 20 percent compared to October, due to robust fall harvests and additional demand for fresh food at Thanksgiving. Year-over-year, reefer volume was up 58 percent in November. The national average reefer rate was $1.74 per mile, up 6 cents (3.6 percent) compared to October and 2 cents (1.2 percent) compared to November 2015.
Flatbed freight availability declined seasonally compared to October, but by only 6.1 percent, a smaller margin than the ten-year average decline of 26 percent. Flatbed volume rose 56 percent compared to November 2015. The increased demand did not translate into an improvement in rates, however. The national average flatbed rate was $1.66 per mile, down 1 cent (-0.6 percent) month over month, and 6 cents (-3.5 percent) compared to November 2015.
Fuel Surcharges Fall
The average fuel surcharge, a component of the total spot market rate paid to carriers, edged down 1 cent per mile for vans, which represents about a 4.5 percent change, depending on the equipment type. The surcharge is pegged to the retail price of diesel fuel, adjusting for average fuel consumption by each trailer type.
Established in 1978, DAT operates a network of load boards serving intermediaries and carriers across North America. For more than a decade DAT has published its Freight Index, which is representative of the dynamic spot market.
Reference rates are the averages, by equipment type, based on $28 billion of actual transactions between freight brokers and carriers, as recorded in DAT RateView. Rates are cited for line haul only, except where noted. Beginning in January 2015, the DAT Freight Index was rebased so that 100 on the Index represents the average monthly volume in the year 2000. Additional trends and analysis are available at DAT Trendlines.