Portland, Ore. – Spot market freight volume got a 38 percent boost from seasonal freight in March, according to the DAT North American Freight Index. Compared to February, van freight availability in March increased 25 percent, flatbed volume rose 64 percent, and reefer volume added 16 percent. Month over month, linehaul rates on the spot market declined 1.4 percent for vans, and 1.8 percent for reefers, but flatbed rates increased 0.6 percent.
 Compared to March 2015, overall spot market freight availability fell 35 percent. Year-over-year declines have been a consistent pattern in every month since January 2015, due to a variety of economic factors including lower demand for transportation services in the spot market combined with loose truck capacity. Demand declined 48 percent for vans, and 45 percent for reefer trailers, while flatbed freight volume was down “only” 16 percent, year over year. Line haul rates fell 16 percent for vans, 11 percent for reefers, and 9.6 percent for flatbeds.
A 51 percent decline in the fuel surcharge, which typically comprises a significant portion of the total rate intermediaries pay carriers contributed to a decline in all-in rates for all equipment types. All-in rates for vans were down 21 percent, reefers declined by 17 percent, and flatbeds were off 16 percent. The surcharge is pegged to the retail cost of diesel fuel.
Intermediaries and carriers across North America listed more than 95 million loads and trucks on the DAT Network of load boards in 2015. As a result of this high volume, the DAT Freight Index is representative of the ups and downs in North American spot market freight movement.
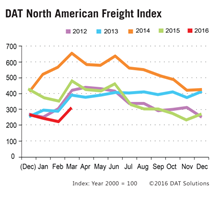
Reference rates are the averages, by equipment type, of thousands of actual rate agreements between freight brokers and carriers, as recorded in DAT RateView. Rates are cited for line haul only, excluding fuel surcharges, except where noted. The monthly DAT North American Freight Index reflects spot market freight availability on the DAT Network of load boards in the United States and Canada. Beginning in January 2015, the DAT Index was rebased so that 100 on the Index represents the average monthly volume in the year 2000. Additional trends and analysis are available at DAT Trendlines.