PORTLAND, Ore., — Truckload freight availability climbed 12 percent last month, compared to September 2015, as the number of loads on the spot market surpassed same-month levels from the previous year for the second consecutrive month. In August, the spot market enjoyed the first year-over-year increase since December 2014, according to the DAT North American Freight Index.
 Dry van and refrigerated (“reefer”) van freight increased by 33 percent and 27 percent, respectively, but flatbed freight volume slipped 13 percent compared to September 2015. Flatbed volume has declined on a year-over-year basis for the past 15 months, due to a downturn in economic sectors, such as oil and gas, that produce flatbed freight.
Month-over-month, spot market freight volume edged up 0.6 percent to the second-highest level this year. This is an atypical seasonal pattern; September volume declined month over month in eight of the previous ten years. A 2.7 percent increase in van freight volume was responsible for the month-over-month growth, as reefer volume dipped 1.1 percent, and flatbeds lost 1.9 percent in September, compared to August.
Van Rates Rise from August to September
The increase in van freight volume boosted spot market rates by 1.4 percent, and reefer rates added 0.6 percent, month over month. September flatbed rates declined 1.2 percent compared to August, however, in a common seasonal pattern.
On a year-over-year basis, the average line haul rate fell 6.0 percent for vans, 4.5 percent for reefers, and 7.8 percent for flatbeds, compared to September 2015. The average fuel surcharge, a component of the total rate paid to carriers, fell 9.1 percent year over year, deepening the decline in carriers’ total revenue per mile. The surcharge is pegged to the retail price of diesel fuel.
Established in 1978, DAT operates a network of load boards serving intermediaries and carriers across North America. For more than a decade DAT has published its Freight Index, which is representative of the dynamic spot market.
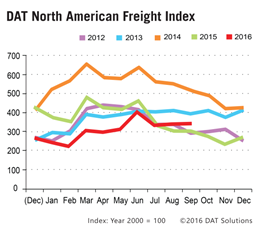
Reference rates are the averages, by equipment type, based on $28 billion of actual transactions between freight brokers and carriers, as recorded in DAT RateView. Rates are cited for line haul only, except where noted. Beginning in January 2015, the DAT Freight Index was rebased so that 100 on the Index represents the average monthly volume in the year 2000. Additional trends and analysis are available at DAT Trendlines.