PORTLAND, Ore., —Spot truckload freight rates hit record highs in May despite a month-over-month decline in volume, a sign that transportation networks are not growing fast enough to keep up with consumer demand.
- Monthly average spot van, refrigerated and flatbed rates set record highs
- Refrigerated and flatbed rates top $3 per mile for the first time
- DAT’s Truckload Volume Index fell 6%, the second straight month of declining volumes
The DAT Truckload Volume Index (TVI) fell to 212 last month, 6% less than April but still the fourth highest month on record. The index is an aggregated measure of dry van, refrigerated (“reefer”) and flatbed loads moved by truckload carriers and an industry standard indicator of commercial freight activity. A baseline of 100 reflects freight volume in January 2015.
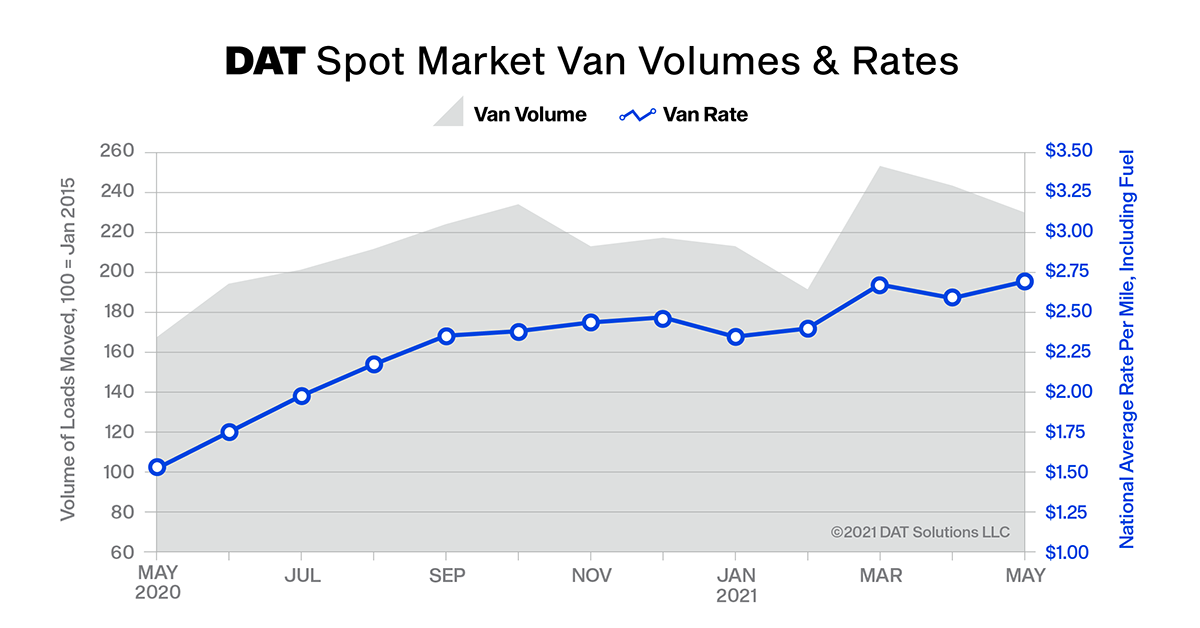
Spot truckload rates hit all-time highs
- The national average rate for van loads on the DAT One load board network increased 10 cents to $2.69 per mile (including fuel surcharge) in May, the highest monthly average van rate on record.
- Refrigerated and flatbed spot rates topped $3 a mile for the first time last month. The national average reefer rate was $3.11 per mile, up 18 cents compared to April. The flatbed rate averaged $3.13 a mile, a 17-cent increase month over month.
May volumes declined after a busy April
- Spot rates were higher despite an overall decrease in volume. The number of van and reefer loads moved on the DAT network declined 6% in May while the number of flatbed loads fell 9%.
- The national average van load-to-truck ratio was 6.1 last month, meaning there were 6.1 available loads for every van posted to the DAT network, up from 4.8 in April. The reefer ratio increased from 9.9 to 13.0; the flatbed ratio was 97.1, the highest monthly average ratio for flatbed freight since April 2018.
Several factors constricted freight volumes in May
- Dwell times increased in May, leaving carriers effectively unavailable for dispatch as they waited for trucks to be loaded or unloaded.
- A surge in imports has chassis trailers in high demand. Drayage rates are up in addition to the length of haul from ports to warehouses.
- The cost of wood pallets has more than doubled due to rising lumber prices. A pallet shortage is threatening the ability of produce distributors to move products at a time when harvest activity is increasing.
“Imbalances and shortages plague supply chains across most segments of the industrial and consumer economies,” said Ken Adamo, Chief of Analytics at DAT Freight & Analytics. “For many businesses, ‘on-time and in-full’ shipments are essential to the efficiency and accuracy of their logistics operation. Right now they’re having to choose one or the other.”
June outlook
- On the shipping calendar, June exerts the most seasonal pressure on truckload rates, with the exception of Black Friday. Southern states are in the middle of peak produce season while those further north are on the cusp of it. Retailers are gearing up for summer and back-to-school shopping. Construction activity increases demand for flatbed equipment.
- Entering June, the national average van spot rate was 93 cents higher compared to the same period last year and 55 cents higher than in 2018, the last time there was a typical summer freight cycle. The reefer rate was 89 cents higher year over year and up 54 cents compared to the same period in 2018.
- Domestic total truckload volumes of produce entered June down 22% year over year (7,600 fewer loads per week). Expect volumes to make a big comeback this summer as restaurants reopen and regulations around social gatherings are relaxed.
- The national average price of on-highway diesel was $3.22 a gallon in May, the highest since December 2018. Spot rates include a calculated surcharge that fluctuates with the price of fuel.
About the DAT Truckload Volume Index
The DAT Truckload Volume Index reflects the change in the number of loads with a pickup date during that month; the actual index number is normalized each month to accommodate any new data sources without distortion. Baseline of 100 equals the number of loads moved in January 2015, as recorded in DAT RateView, a database of rates paid on an average of 3 million loads per month. DAT national average spot rates are derived from RateView and include only over-the-road lanes with lengths of haul of 250 miles or more. Spot rates represent the payments made to carriers by freight brokers, third-party logistics providers and other transportation buyers.