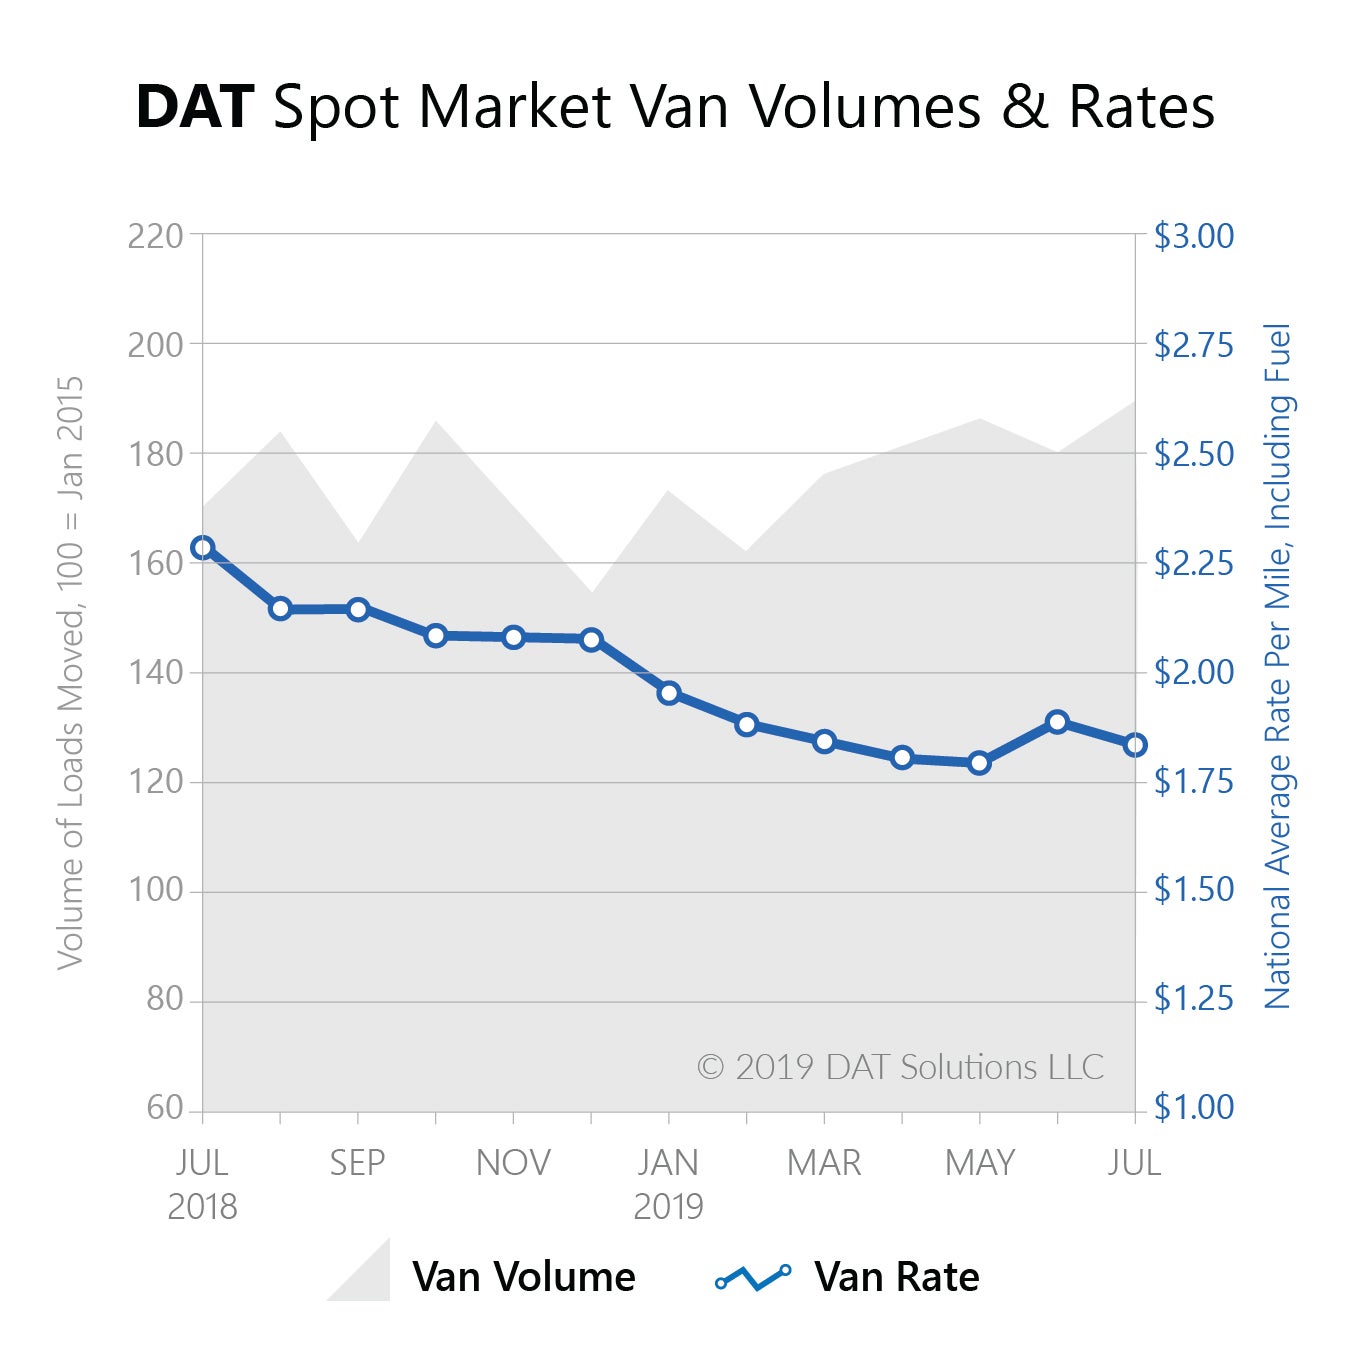
PORTLAND, Ore. — Spot market truckload rates retreated in July, despite an increase in freight volume. Shipments of dry van freight – the most common truckload shipment – rose 6.8 percent in July compared to June, according to the DAT Truckload Volume Index, which reflects the change in the actual number of spot market loads moved each month. The national average van rate declined seasonally from June to July, however.

“That trend is not uncommon,” said Peggy Dorf, Market Analyst with DAT Solutions.
“July often marks the beginning of a downward turn for truckload rates,” she explained. “That has less to do with volume than the fact that, after the close of Q2 and the end of the Fourth of July holiday, shippers feel less urgency to get deliveries made by a specific date.”
While those trends may have been predictable, the announcement of new tariffs on Chinese imports beginning Sept. 1 could disrupt typical seasonal trends in late summer.
“There was an uptick in activity at the end of July, and that could carry over into August,” said Dorf. “Shippers may rush to move imports ahead of the new tariffs, which could disrupt what would normally be the summer doldrums for pricing.”
The national average van rate in July was $1.84 per mile, which includes fuel surcharges. While that was a 5-cent decline from the June average, it was otherwise the highest monthly average for vans since March. Year over year, the national rate was 43 cents lower than the historic highs set in July 2018, even though volume this July was up 13 percent compared to last year.
Harsh weather curtailed and/or delayed many produce harvests this year. That disrupted refrigerated (“reefer”) shipments, but improved yields out of California contributed to an 8.7 percent increase in reefer volume from June to July. Reefer rates averaged $2.19 per mile nationally, a 6-cent drop from June but otherwise the highest monthly average since February. The July 2019 average was down 41 cents from July 2018, even though volume increased 12 percent compared to last year.
Flatbed volume also rose in July, up 6.6 percent month over month, although the national average flatbed rate fell to $2.27 per mile, 3 cents below the June rate and 50 cents below the sky-high average of July 2018. Compared to last year, flatbed volume was up 18 percent.
“Truckload pricing followed normal seasonal patterns in July, despite uncertainty in some segments of the economy,” said Dorf. “Moving forward, the new tariffs are a wild card, on top of the potential risks to supply chain operations during hurricane season.”
About the DAT Truckload Freight Volume Index
The DAT Truckload Freight Volume Index reflects the change in the number of loads with a pickup date during that month; the actual index number is normalized each month to accommodate any new data sources without distortion. Baseline of 100 equals the number of loads moved in January 2015, as recorded in DAT RateView, a database of rates paid on an average of 3 million loads per month. DAT national average spot rates are derived from RateView and include only over-the-road lanes with lengths of haul of 250 miles or more. Spot rates represent the payments made by freight brokers and 3PL to the carriers.