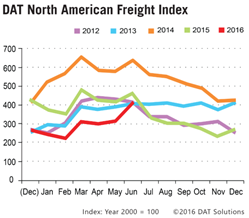
Portland, Ore. – Seasonal freight added 28 percent to spot market load availability in June, boosting total volume to levels seen in 2013 and 2012, and only 12 percent below 2015 totals, according to the DAT North American Freight Index. It is typical for freight volume to increase in June and decline in July, but this year’s surge also jump-started volume and rates in July to-date.
 Month over month by equipment type, dry and refrigerated (“reefer”) vans enjoyed the biggest volume increases, up 49 percent and 39 percent, respectively. Both segments had seen only single-digit increases in June of the previous four years. Flatbed freight increased only 7.1 percent, a more typical increase for the month.
Average line haul rates followed the same pattern on the spot market in June, with an increase of 4.4 percent for vans and 3.6 percent for reefers, while flatbed rates rose only 0.6 percent, month over month. The average fuel surcharge also increased 10 percent, compared to May. The surcharge, which is pegged to the retail price of diesel fuel, comprises a portion of the total rate paid to carriers.
On a year-over-year basis, van freight volume increased 3.4 percent compared to June 2015. It was the first year-over-year improvement for vans, which comprise a large majority of for-hire trucks, in any month since December 2014. Reefer freight availability declined 5.4 percent, however, and flatbeds lost 28 percent.
Line haul rates were lower for all equipment types, falling 11 percent for vans, 8.9 percent for reefers, and 7.5 percent for flatbeds compared to June 2015. Total carrier revenue was eroded further by a 28 percent ($0.08 per mile) decline in the fuel surcharge compared to June 2015.
Established in 1978, DAT operates a network of load boards serving intermediaries and carriers across North America. For more than a decade DAT has published its Freight Index, which is representative of the dynamic spot market.
Reference rates are the averages, by equipment type, based on $28 billion of actual transactions between freight brokers and carriers, as recorded in DAT RateView. Rates are cited for line haul only, except where noted. Beginning in January 2015, the DAT Freight Index was rebased so that 100 on the Index represents the average monthly volume in the year 2000. Additional trends and analysis are available at DAT Trendlines.