Portland, Ore – Spot market freight volume and rates declined in July, following a typical, seasonal pattern. Van freight levels dropped 24 percent month over month, refrigerated freight was down 23 percent, and flatbeds were off 33 percent, for an overall decline of 27 percent compared to June.
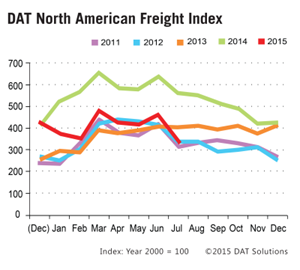 In contrast to last year’s record volume, July freight was 40 percent lower; volume fell below the same-month total of 2013 for the first time this year. However, freight availability remained strong compared to 2012 and all prior years, according to the DAT North American Freight Index.
Rates on the spot market followed the month-over-month volume trends by equipment type, declining 1.9 percent for vans, 2.1 percent for flatbeds, and 4.2 percent for reefers.
Comparing freight volume to July 2014 by equipment type, vans declined 33 percent, reefers were down 20 percent, and flatbeds dropped 50 percent. Line haul rates declined only 0.6 percent for vans, while flatbeds lost 3.7 percent and reefers edged down 0.5 percent, year over year. However, the average total rate paid to carriers declined more steeply, due to lower diesel prices that yielded a 40 percent reduction in the fuel surcharge.
Intermediaries and carriers across North America listed more than 120 million loads and trucks last year on the DAT Network of load boards. As a result of this high volume, the DAT Freight Index is representative of the ups and downs in North American spot market freight movement. In 2015, DAT re-formulated the Index with 2000 as the baseline year.
Reference rates are the averages, by equipment type, of thousands of actual rate agreements between freight brokers and carriers, as recorded in DAT RateView. Rates are cited for line haul only, excluding fuel surcharges, except where noted. The monthly DAT North American Freight Index reflects spot market freight availability on the DAT Network of load boards in the United States and Canada. Beginning in January 2015, the DAT Index was rebased so that 100 on the Index represents the average monthly volume in the year 2000. Additional trends and analysis are available at DAT Trendlines.