Portland, Ore – Following a common seasonal pattern, spot market freight volume declined 8.8 percent month over month in August, according to the DAT North American Freight Index. The Index declined from July to August in four of the past ten years. This year’s fall freight season, which sometimes begins in mid-August, appears to be starting a few weeks later, the company reported.
By equipment type, van freight levels dropped 3.7 percent month over month, refrigerated (“reefer”) freight edged down 0.4 percent, and flatbeds were off 18 percent, for an overall decline of 8.8 percent compared to July. The company added that early indications suggest improving van and reefer freight availability in September.
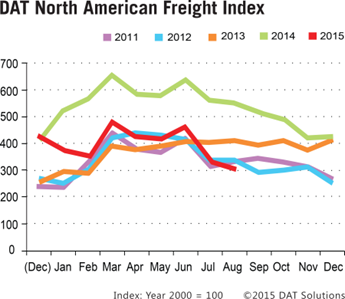 Compared to the extraordinary volume of 2014, August freight was down 44 percent. Volume for August also fell below same-month totals for the past four years, but freight availability remained strong compared to the previous five-year period, from 2005 through 2010, which included a recession.
Line haul rates on the spot market followed the month-over-month volume trends by equipment type, declining 1.3 percent for vans, 2.7 percent for reefers, and 2.2 percent for flatbeds. However, the average total rate paid to carriers declined more steeply, due to lower diesel prices that yielded a 14 percent reduction in the fuel surcharge compared to July. Carriers are typically paid a sum of the line haul rate and the fuel surcharge, on a per-mile basis. With fuel included, the total rate declined 3.3 percent for both vans and flatbeds, and fell 4.2 percent for reefers.
Comparing freight volume to August 2014 by equipment type, year over year, vans declined 35 percent, reefers were down 29 percent, and flatbeds dropped 57 percent. Line haul rates declined only 1.3 percent for vans, while reefer rates dipped 1.1 percent and flatbeds lost 5.8 percent compared to August 2014, but total rates declined by 11 to 15 percent, due to a 49 percent decline in the fuel surcharge over the year.
Intermediaries and carriers across North America listed more than 120 million loads and trucks last year on the DAT Network of load boards. As a result of this high volume, the DAT Freight Index is representative of the ups and downs in North American spot market freight movement. In 2015, DAT re-formulated the Index with 2000 as the baseline year.
Reference rates are the averages, by equipment type, of thousands of actual rate agreements between freight brokers and carriers, as recorded in DAT RateView. Rates are cited for line haul only, excluding fuel surcharges, except where noted. The monthly DAT North American Freight Index reflects spot market freight availability on the DAT Network of load boards in the United States and Canada. Beginning in January 2015, the DAT Index was rebased so that 100 on the Index represents the average monthly volume in the year 2000. Additional trends and analysis are available at DAT Trendlines.