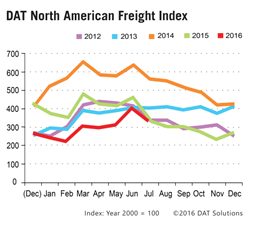
Portland, Ore. – July spot market freight availability caught up with 2015 levels for the first time this year, due to an increase in volume for dry and refrigerated (“reefer”) van trailers, and despite a year-over-year flatbed freight volume decline. Also unusual was a rate increase for van trailers in July, compared to June. Van rates typically peak in June and decline in July, according to the DAT North American Freight Index.
 The increased spot market volume can be attributed to recent cutbacks by the large fleets that typically work with shippers on a contractual basis. “As trucks are withdrawn from the marketplace, shippers are beginning to assign a larger portion of freight to third party logistics providers and freight brokers,” said Mark Montague, industry pricing analyst at DAT. “If these trends continue, spot market volume could exceed 2015 levels for the rest of the quarter, driving rates up,” he said.
As this marketplace transition progresses, the impact varies by equipment type. Compared to July 2015, van freight volume increased 17 percent, and reefers gained 5.2 percent. Flatbed volume declined 18 percent, however, due partly to prolonged cutbacks in the energy, manufacturing and construction sectors that generate flatbed freight.
Despite these higher volumes, truckload rates fell for all spot market equipment year over year This has been a consistent trend for 14 months, but the declines in July were less steep compared to the first half of 2016, especially for vans and reefers. Compared to July 2015, van rates dropped 6.5 percent, reefers lost 6.0 percent, and flatbed rates fell 7.1 percent. The average fuel surcharge declined 23 percent, meanwhile, driving down the total revenue per mile by 9.4 percent for vans and flatbeds, and 9.0 percent for reefers. The surcharge, which varies with the price of diesel fuel, is included in the total rate paid to carriers.
Month over month, total spot market freight volume declined 17 percent from the June peak, which is typical for the season. Van and reefer freight each lost 14 percent, and flatbeds slid 23 percent. Bucking the typical trend, however, July’s van rates exceeded the June average for the first time in the six years since DAT began publishing spot market rates, with a 1.4 percent ($0.02 per mile) increase. Reefer rates declined 1.7 percent ($0.03) which indicates relative strength when compared to the 5.2 percent average decline in July of the previous six years. Flatbed rates fell 2.3 percent ($0.04) which is typical for the season.
Established in 1978, DAT operates a network of load boards serving intermediaries and carriers across North America. For more than a decade DAT has published its Freight Index, which is representative of the dynamic spot market.
Reference rates are the averages, by equipment type, based on $28 billion of actual transactions between freight brokers and carriers, as recorded in DAT RateView. Rates are cited for line haul only, except where noted. Beginning in January 2015, the DAT Freight Index was rebased so that 100 on the Index represents the average monthly volume in the year 2000. Additional trends and analysis are available at DAT Trendlines.