Portland, Ore – Spot market freight volume remained strong in May, edging down just 1.7 percent compared to April, according to the DAT North American Freight Index. Compared to the extraordinary volume of May 2014, freight declined 27 percent. Compared to long-term historical trends, volume exceeded same-month totals for 16 of the 18 years since the DAT Freight Index was established in 1997.
 By equipment type, May freight volume dipped 0.8 percent month over month for vans and 4.6 percent for flatbeds, while refrigerated (“reefer”) freight increased 8.1%. Rates on the spot market followed the trends in volume by equipment type, slipping 1.9 percent for vans and 0.5 percent for flatbeds, while reefer rates rose 2.7 percent, compared to April. Fuel prices increased from April to May, and the additional surcharge led to an increase in the total rate paid for flatbeds as well as reefers, but the total rate for vans declined month over month despite the surcharge.
On a year-over-year basis, freight volume declined 16 percent for vans and 41 percent for flatbeds, but increased 2.5 percent for reefers, compared to May 2014. Line haul rates trended up, with van rates adding 4.7 percent, flatbeds up 2.2 percent, and reefer rates rising 2.7 percent, year over year. The total rate declined for all equipment types, however, due to a steep drop in fuel prices and associated surcharges.
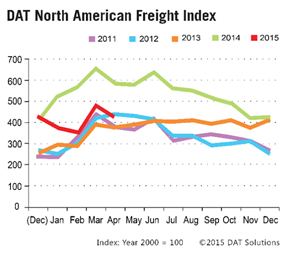
Intermediaries and carriers across North America listed more than 120 million loads and trucks last year on the DAT Network of load boards. As a result of this high volume, the DAT Freight Index is representative of the ups and downs in North American spot market freight movement. In 2015, DAT re-formulated the Index with 2000 as the baseline year.
Reference rates are derived from DAT RateView. Rates are cited for line haul only, excluding fuel surcharges, except where noted. The monthly DAT North American Freight Index reflects spot market freight availability on the DAT Network of load boards in the United States and Canada. Beginning in January 2015, the DAT Index was rebased so that 100 on the Index represents the average monthly volume in the year 2000. Additional trends and analysis are available at DAT Trendlines.