Portland, Ore – Spot market freight volume rose 34 percent in March compared to February, which is typical for the season, according to the DAT North American Freight Index. By comparison, March 2015 freight availability declined 28 percent. The spring freight season usually begins in late March, but a prolonged winter in 2014 led to unprecedented volume throughout the entire first quarter.
 By equipment type, freight volume increased month-over-month: 34 percent for vans, 41 percent for flatbeds and 20 percent for refrigerated (“reefer”) trailers. Truckload freight rates on the spot market rose seasonally for all equipment types: van rates increased 2.5 percent, flatbeds added 2.8 percent, and reefers were up 1.7 percent, compared to February.
Compared to the extraordinary market conditions of March 2014, year over year, freight volume by equipment type declined 19 percent for vans, 42 percent for flatbeds and 1.3 percent for reefers. Rates trended up, however: van rates rose 2.5 percent, flatbeds were up 6.9 percent, and reefer rates rose 6.4 percent, compared to March 2014. Monthly average rates have increased year over year for more than 20 consecutive months.
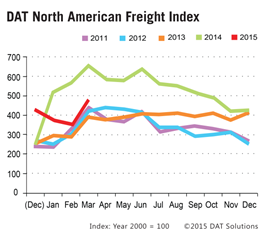
Intermediaries and carriers across North America listed more than 120 million loads and trucks last year on the DAT Network of load boards. As a result of this high volume, the DAT Freight Index is representative of the ups and downs in North American spot market freight movement. In 2015, DAT re-formulated the Index with 2000 as the baseline year.
Reference rates are derived from DAT RateView. Rates are cited for line haul only, excluding fuel surcharges, which declined significantly on both a month-over-month and year-over-year basis. The monthly DAT North American Freight Index reflects spot market freight availability on the DAT Network of load boards in the United States and Canada. Beginning in January 2015, the DAT Index was rebased so that 100 on the Index represents the average monthly volume in the year 2000. Additional trends and analysis are available at DAT Trendlines.