Portland, Ore – Spot market freight volume increased 9.0 percent in June, compared to May, due to seasonal trends that also drove rates up for all equipment types. Last month’s strong volume exceeded same-month totals for all prior years except 2014, according to the DAT North American Freight Index. Freight availability declined 28 percent compared to last year’s atypical results.
 By equipment type, June freight volume expanded 8.1 percent month over month for vans, 9.7 percent for flatbeds, and 6.6 percent for refrigerated (“reefer”) trailers. Rates on the spot market followed the trends in volume by equipment type, adding 1.3 percent for vans, 0.5 percent for flatbeds, and 2.1 percent for reefers, compared to May.
On a year-over-year basis, freight volume declined 25 percent for vans and 35 percent for flatbeds, but increased 0.5 percent for reefers, compared to June 2014. Line haul rates for vans declined 1.3 percent, flatbeds lost 1.6 percent, and reefer rates edged down 0.5 percent, year over year. The average total rate paid to carriers declined more steeply for all equipment types, however, due to the drop in fuel prices that led to a 40 percent decline in the fuel surcharge.
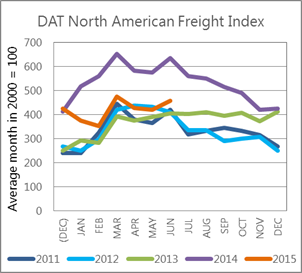
Intermediaries and carriers across North America listed more than 120 million loads and trucks last year on the DAT Network of load boards. As a result of this high volume, the DAT Freight Index is representative of the ups and downs in North American spot market freight movement. In 2015, DAT re-formulated the Index with 2000 as the baseline year.
Reference rates are the averages, by equipment type, of thousands of actual rate agreements between freight brokers and carriers, as recorded in DAT RateView. Rates are cited for line haul only, excluding fuel surcharges, except where noted. The monthly DAT North American Freight Index reflects spot market freight availability on the DAT Network of load boards in the United States and Canada. Beginning in January 2015, the DAT Index was rebased so that 100 on the Index represents the average monthly volume in the year 2000. Additional trends and analysis are available at DAT Trendlines.