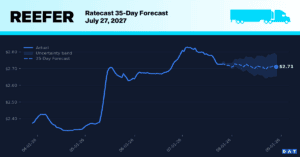
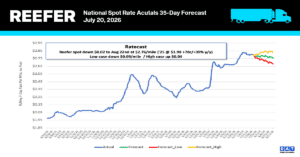
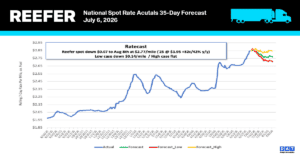
Reefer Report: California reefer rates hold firm as volumes fall
The ongoing re-pricing of the truckload market remains supply-led, a trend underscored this week by tightening rates for California citrus

The ongoing re-pricing of the truckload market remains supply-led, a trend underscored this week by tightening rates for California citrus
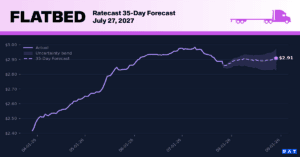
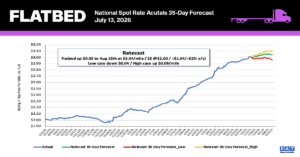
Flatbed spot linehaul averaged $2.87 per mile this week, down 2.7%, or $0.08 per mile, from the prior week. Rates
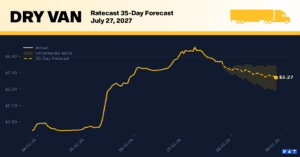
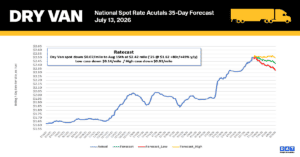
Dry van spot linehaul averaged $2.38 per mile this week, down 2.5%, or $0.06 per mile, from the prior week.
Last week’s post-holiday tightness didn’t just fade — it reversed. Across nearly every district, USDA flipped truck availability a full

Every carrier, broker, and shipper trying to plan around today’s truckload market has been asking the same question: is this

Every conversation about artificial intelligence tends to focus on chips and software, but for carriers and brokers, the real story

California truckload capacity flipped from loose to tight in a single week. Six districts — Imperial/Coachella, Kern, Oxnard, Salinas-Watsonville, Santa
Manufacturing kept expanding in June, with the ISM Manufacturing PMI coming in at 53.3%, marking a sixth straight month of
July isn’t just the heart of summer; it’s National Hot Dog Month and the absolute peak of America’s grilling season.
This week’s report is about reversals. Mexico Crossings through South Texas flipped from Slight Shortage of capacity back to Slight
The April trucking ton-mile index reveals that the recent spike in trucking freight rates is almost entirely supply-side driven, rather

U.S. trucking activity hit a bit of a speed bump this spring, with the ATA Tonnage Index May 2026 contracting