Every conversation about artificial intelligence tends to focus on chips and software, but for carriers and brokers, the real story is what it takes to build the data centers powering it all. As a rough planning figure and using back-of-envelope estimate built on a materials-intensity, each gigawatt of new data center capacity translates to roughly 100,000 truckloads of concrete, structural steel, transformers, switchgear, and generators — before a single server ever gets plugged in. The U.S. has built out roughly 20 gigawatts of new capacity since the AI boom took off in 2023, which works out to about 2 million truckloads already moved, much of it concentrated in flatbed-heavy corridors rather than spread evenly across the map.
Get the clearest, most accurate view of the truckload marketplace with data from DAT iQ.
Tune into DAT iQ Live, live on YouTube or LinkedIn, 10am ET every Tuesday.
The pipeline ahead dwarfs what’s already moved. Announced capacity for 2026 and 2027 runs close to 50 gigawatts combined — call it 5 million more truckloads over the next two years, with several million more behind that through 2030. But being announced isn’t the same as moving: only about a third of the 2026 pipeline is currently under active construction, and industry estimates suggest close to half of announced projects could slip or get canceled. The bottleneck has shifted away from chips and onto power equipment — transformers, switchgear, and batteries, some of which sit on multi-year waitlists. That means the freight is real, but it’s lumpy and back-loaded, following the 18-to-24-month construction clock rather than the press-release calendar.
For carriers, this is durable flatbed and heavy-haul demand, but knowing which lanes feed active builds — not just announced ones — is the difference between positioning ahead of the freight and chasing it after the fact. For brokers, the risk cuts both ways: staging capacity against a project that stalls or cancels is capacity you’ve stranded. The signal to watch isn’t the next big announcement — it’s construction starts, power equipment lead times, and regional concentration, since this build is clustering in specific power- and labor-constrained markets rather than spreading nationally. The gap between what’s announced and what’s actually breaking ground is where the real freight opportunity — and risk — lives.
National flatbed market spot rate analysis
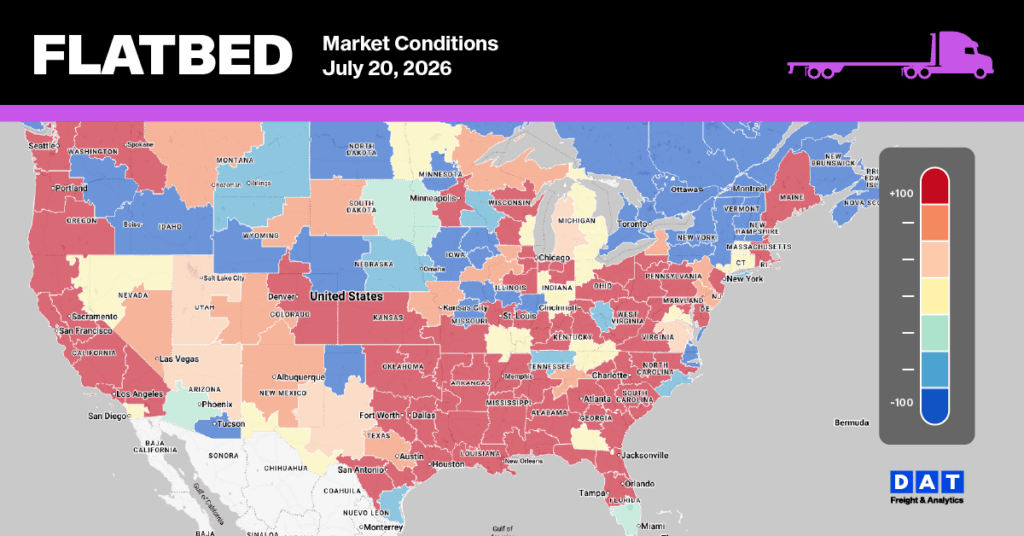
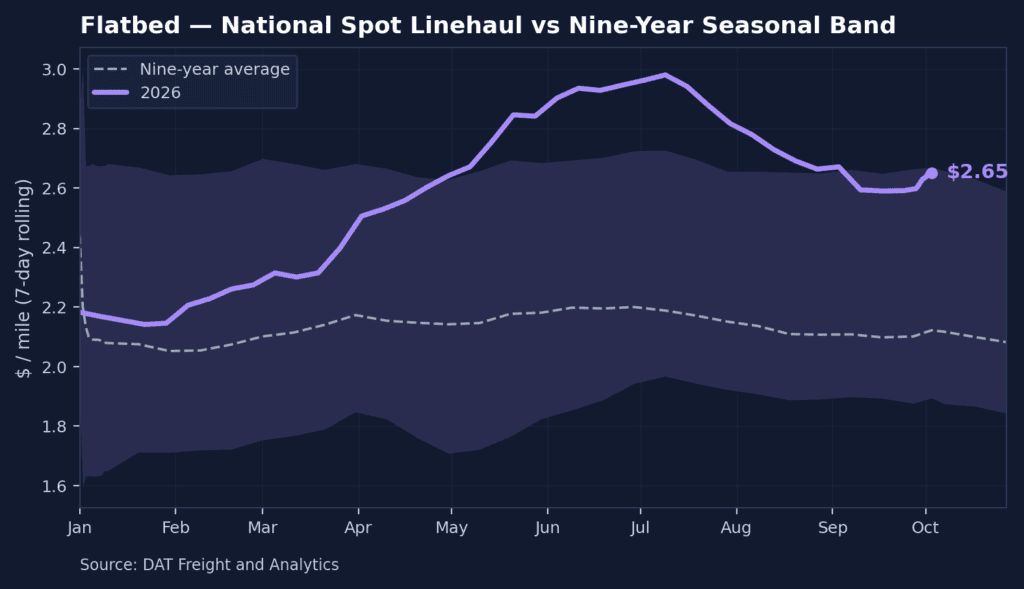
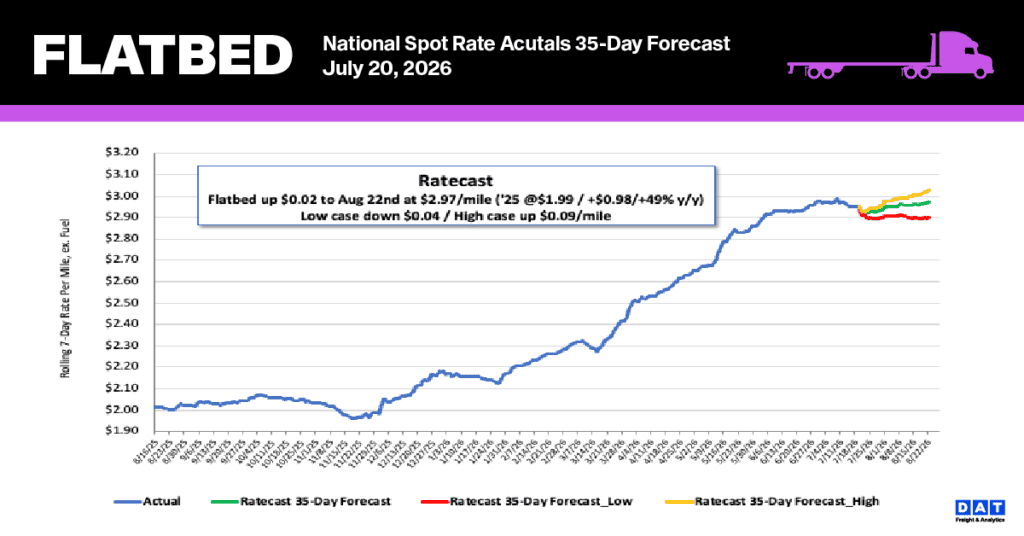
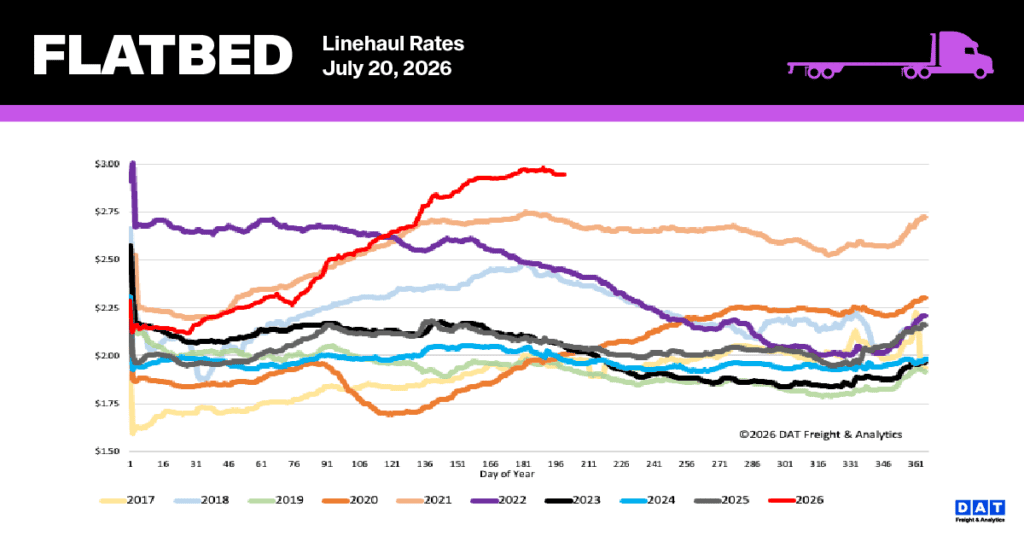
Last week, the national flatbed spot rate decreased by $0.05 per mile to an average of $2.95, following a period of stabilization in the preceding week. Despite this downward movement, the fuel-excluded 7-day rolling average continues to hold at historic highs, exceeding the previous record set in Week 29 of 2021 by $0.24. This pricing reflects a substantial 44% ($0.89) surge over last year’s performance and remains 32% ($0.93) above the five-year non-pandemic historical baseline. Concurrently, across the regional Bellwether states (TX, GA, PA, AL, OK, IL, TN, SC, AR, CA), spot rates within this vital 10-state industrial corridor—which represents approximately 55% of the country’s total load volume—fell by $0.10 to an average of $3.50 per mile as local capacity experienced a slight easing.
Flatbed market conditions
Last week, equipment availability rebounded by 8%, returning to post levels nearly identical to those seen just before the July 4 break. Meanwhile, load post volumes fell by 8% over the week but remain approximately 48% higher year-over-year. Driven by these shifts, the national flatbed load-to-truck ratio decreased by 15% to settle at 44.07.