Dry Van Report: Rates cool off as summer freight demand normalizes
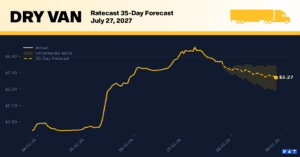
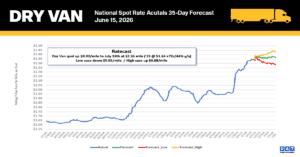
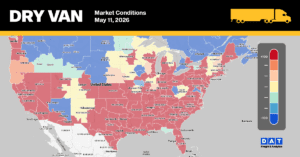
Dry van spot linehaul averaged $2.38 per mile this week, down 2.5%, or $0.06 per mile, from the prior week.
Dry van spot linehaul averaged $2.38 per mile this week, down 2.5%, or $0.06 per mile, from the prior week.

Every carrier, broker, and shipper trying to plan around today’s truckload market has been asking the same question: is this
July isn’t just the heart of summer; it’s National Hot Dog Month and the absolute peak of America’s grilling season.
The April trucking ton-mile index reveals that the recent spike in trucking freight rates is almost entirely supply-side driven, rather
The construction backlog tells carriers and brokers where the freight is heading, and right now it points at data centers.

The May LMI recorded Transportation Prices at 96.0 — the highest reading ever posted for any metric in the index’s
The truckload sector is currently trapped in a tale of two entirely different economies, leaving many carriers dealing with an
U.S. manufacturing just posted its strongest reading since May 2022. The ISM Manufacturing PMI came in at 54.0% in May
Freight volumes were essentially unchanged in the first quarter, but what shippers paid to move their goods tells a very
All rates cited below exclude fuel surcharges, and load volume refers to loads moved unless otherwise noted. The rate charts

U.S. manufacturing expanded in April for the fourth consecutive month, with the ISM Manufacturing PMI holding steady at 52.7% —
Data Analysis for the Week Ending Saturday, May 9th, 2026. All rates cited below exclude fuel surcharges, and load volume