The May LMI recorded Transportation Prices at 96.0 — the highest reading ever posted for any metric in the index’s ten-year history — while Transportation Capacity contracted to 31.7, now in its sixth consecutive month below 50. That 64.3-point spread between prices and available capacity is the starkest supply-demand imbalance the LMI has ever captured, and it’s being felt across the entire supply chain. The trigger is the Strait of Hormuz closure, which has taken roughly 20% of global oil exports offline and sent fuel costs — and with them, transportation prices — surging since late February.
Get the clearest, most accurate view of the truckload marketplace with data from DAT iQ.
Tune into DAT iQ Live, live on YouTube or LinkedIn, 10am ET every Tuesday.
The tightness isn’t evenly distributed. Upstream manufacturers, scrambling to pull freight forward ahead of further cost increases, reported Transportation Capacity contracting at 25.7 — significantly faster than the 45.3 contraction reported by Downstream retailers. Small carriers are bearing the sharpest end of the pricing spike, with firms under 1,000 employees reporting Transportation Prices at 98.2, the highest sub-reading ever recorded and statistically higher than the 93.3 reported by larger firms. Scale matters in a market this tight, and smaller operators have less of it.
There’s no near-term relief in sight. Respondents forecast Transportation Capacity will continue contracting at 40.4 over the next 12 months, while Transportation Prices are expected to keep expanding at 91.4. That spread may narrow slightly from today’s historic extreme, but the directional signal is clear — this is a carrier’s market, and supply chain managers should be planning around elevated transportation costs well into 2027.
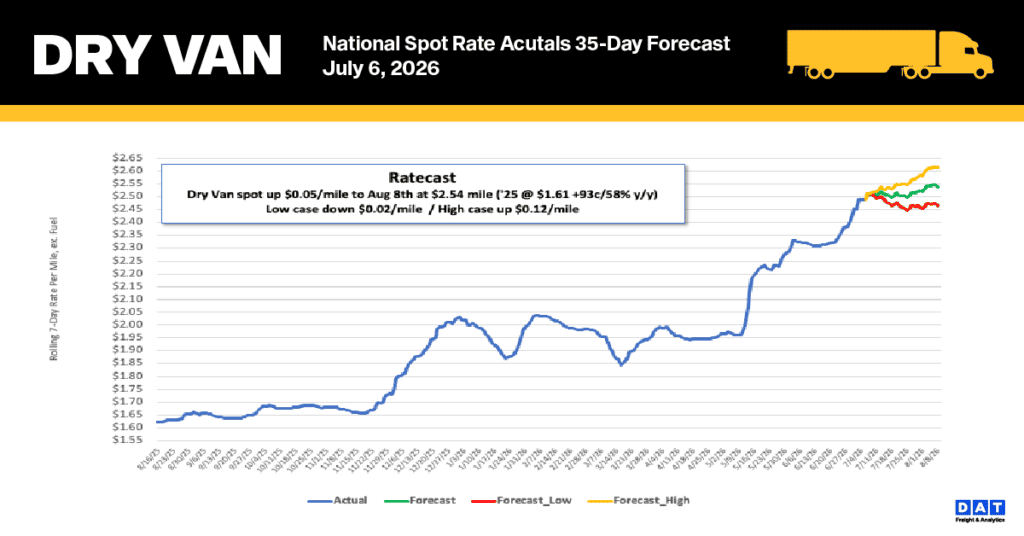
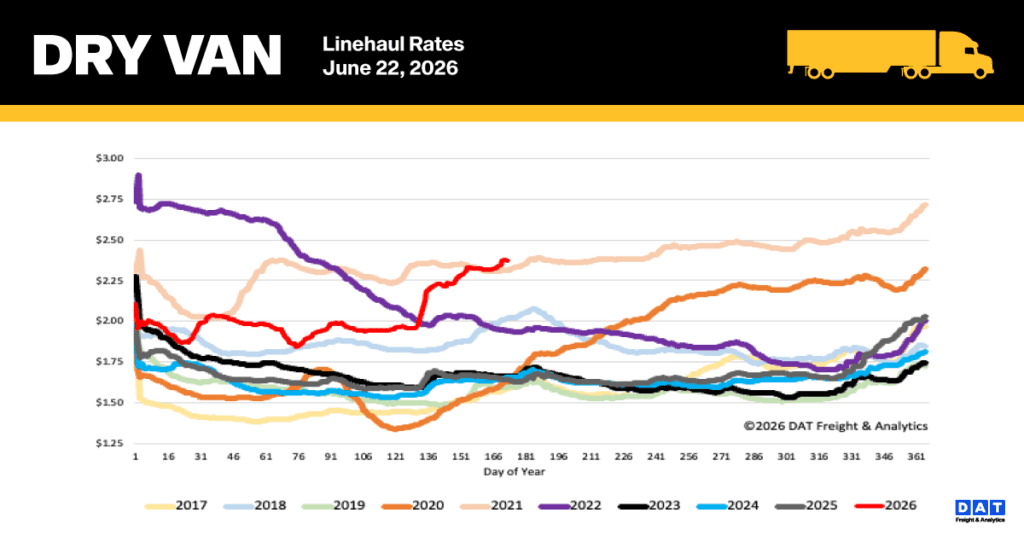
National Dry Van spot rate performance
The national 7-day rolling average linehaul rate edged up by a cent last week to $2.38 per mile, continuing a three-week plateau that has preserved most of the gains from Roadcheck Week. This set a new record for Week 25, surpassing the 2021 high by $0.06. Currently, rates are notably high — 45% ($0.74) above last year’s levels and 30% ($0.72) higher than the five-year average for non-pandemic periods.
Regional and Lane-Specific Insights
- Top-Tier Lanes: Rates across DAT’s 50 most-monitored lanes rose by a penny to reach $2.87 per mile.
- Core Midwest Region: As capacity restrictions loosened on major routes, rates in this critical 13-state market—which represents nearly 50% of national load volume—dropped by $0.04 to an average of $2.72 per mile.
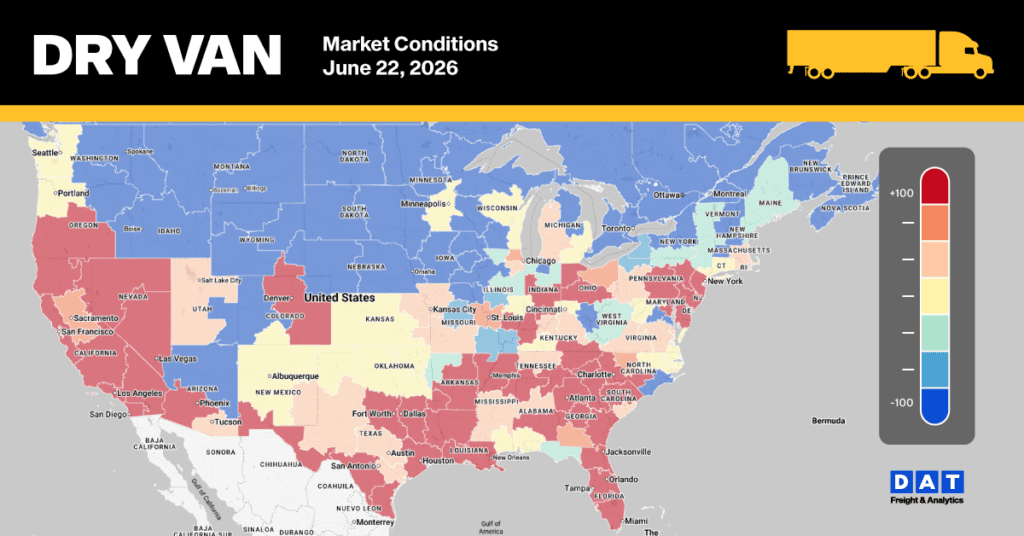
Dry Van Market Conditions
While load posting activity remained relatively flat over the previous week, volumes continue to significantly outpace historical benchmarks, tracking 42% ahead of the Week 25 long-term average and 44% above prior-year levels. Conversely, equipment availability contracted as capacity further retracted from the market; truck posts declined by 10% for the week and are now 24% lower than last year. This tightening of supply helped drive a 10% increase in the national dry van load-to-truck ratio, which climbed to 9.60.