Dry van spot rates
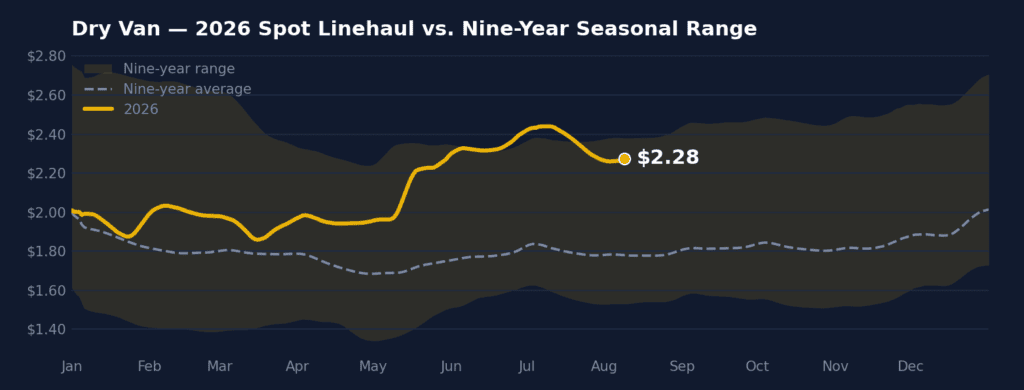
Dry van spot linehaul averaged $2.28 per mile this week, minus fuel, down 1.8%, or $0.04 per mile, from the prior week. Rates climbed 40.5%, or $0.65 per mile, year over year and held 27.5%, or $0.49 per mile, above the nine-year seasonal average of $1.78 per mile, near the top of the historical range.
All rates cited are linehaul only. They exclude fuel costs and surcharges unless otherwise noted.
Get the clearest, most accurate view of the truckload marketplace with data from DAT iQ.
Tune into DAT iQ Live, live on YouTube or LinkedIn, 10am ET every Tuesday.
Bellwether states
The 10 dry van bellwether states posted a moves-weighted outbound rate of $3.01 per mile this week, down 2.1%, or $0.06 per mile, week over week and up 44.9%, or $0.93 per mile, year over year. The roster carried 35.6% of all U.S. state-outbound dry van loads, in line with its recent baseline near 35%.
Regional rate trends
| Dry Van — Top 10 Origins by Rate Per Mile · Week Ending August 7, 2026 | ||||
|---|---|---|---|---|
| Rank | Origin Region | Avg RPM | WoW % | YoY % |
| 1 | California | $2.61 | -2.7% | +38.9% |
| 2 | Ohio River | $2.55 | -0.6% | +40.8% |
| 3 | Great Lakes | $2.46 | -0.3% | +36.0% |
| 4 | Southeast | $2.43 | -3.6% | +47.3% |
| 5 | Carolinas | $2.38 | -3.7% | +44.5% |
| 6 | Lower Midwest | $2.36 | -2.4% | +36.8% |
| 7 | South Central | $2.29 | -3.8% | +40.0% |
| 8 | Upper Atlantic | $2.13 | +0.5% | +28.8% |
| 9 | Lower Mountain | $1.87 | -2.5% | +32.0% |
| 10 | Florida-So Georgia | $1.66 | -5.1% | +43.3% |
The top 10 origins carried 87.8% of all U.S. outbound loads moved in the week. Upper Atlantic led week over week at +0.5%, while most leading origins eased from the prior week as summer volumes softened.
Market conditions
Load posts were down 6.6% week over week and up 30.9% year over year, while truck posts were down 3.7% week over week and down 31.3% year over year. With freight easing faster than capacity, the load-to-truck ratio eased to 10.38, down from 10.71 a week earlier but still well above 5.45 a year ago.
Short-term outlook
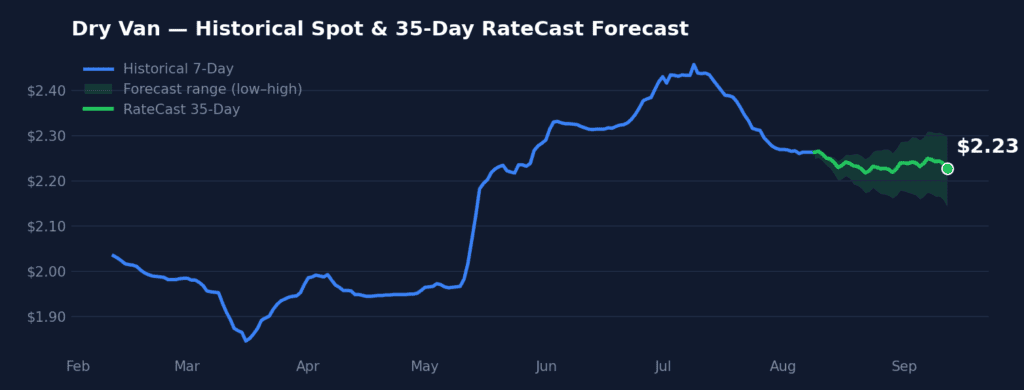
The 35-day DAT Rate Forecast puts dry van spot linehaul at $2.23 per mile in mid-September, within an uncertainty band of about plus or minus $0.08 per mile, or 3.5% of the forecast point. Across equipment, the dry van band ranks widest. That end-of-forecast rate stands about $0.59 per mile above the actual rate near the same date a year earlier, $1.64 per mile.
Freight demand outlook
The July Logistics Managers’ Index read 68.9, down 2.2 points from June’s 71.1, which had been the fastest overall expansion since March 2022. Even with the pullback, July still tops every monthly reading recorded from 2023 through 2025, so the logistics economy is expanding at a pace carriers have not seen in years. Most of the July slowdown came from cooler inventory growth rather than any easing on the transportation side. Retailers appear to have slowed the pull-forward buying that ran ahead of new tariffs, while wholesalers and manufacturers kept building. That upstream stockpiling is the backdrop truckload carriers should keep in mind, because it points to freight that still has to move.
Transportation capacity is where the story stays firmly in carriers’ favor. The capacity index fell another 2.4 points to 28.4, marking the eighth straight month of contraction and tying April as the second-fastest contraction the index has recorded, trailing only September 2020. Contraction ran even harder in the first half of the month at 24.4 before easing to 32.7 later in July, and larger fleets reported the tightest conditions at 21.9. The squeeze is showing up in booking behavior, with tender lead times stretching to an average of 3.74 days, up 11% from a year ago. Shippers are having to commit earlier to secure trucks, and respondents expect the pressure to persist, forecasting continued capacity contraction at 40.4 over the next 12 months.
On the cost side, transportation prices eased 5.5 points to 86.9 but remain deep in expansion territory, and the LMI attributes the retreat from record highs to fuel rather than any loss of pricing power. Diesel finished July at $5.313 per gallon, up 51 cents since hostilities with Iran restarted in mid-July, which has helped push some freight toward intermodal now running roughly 30% cheaper than over the road. For truckload carriers, the combination is favorable: tight capacity, elevated price expansion, and utilization still strong at 65.0 even after a 9.7-point drop from June’s record. Respondents expect prices to keep climbing, projecting a future transportation prices reading of 89.2. Carriers should watch two things heading into peak season: whether diesel keeps steering freight to rail, and whether the inventory now sitting upstream shifts downstream the way it did late last year, which would add a fresh wave of volume onto already scarce capacity.
Weekly reports