While van and reefer prices have moderated in March and April after peaking in early January, flatbed prices and demand stayed red-hot. The national average flatbed rate hit its highest level since DAT began publishing spot market rates in 2010.

Flatbed rates have experienced a steady climb over the past two years. Here’s how the current national average rate compares with previous years:
- May 2016: $1.92 per mile
- May 2017: $2.10 per mile
- May 2018: $2.71 per mile (month-to-date)
Line haul rates, excluding the fuel surcharge, have risen about 35% since May 2016. When fuel is included, there’s been a 41% increase in the total rate paid by brokers to the carriers.
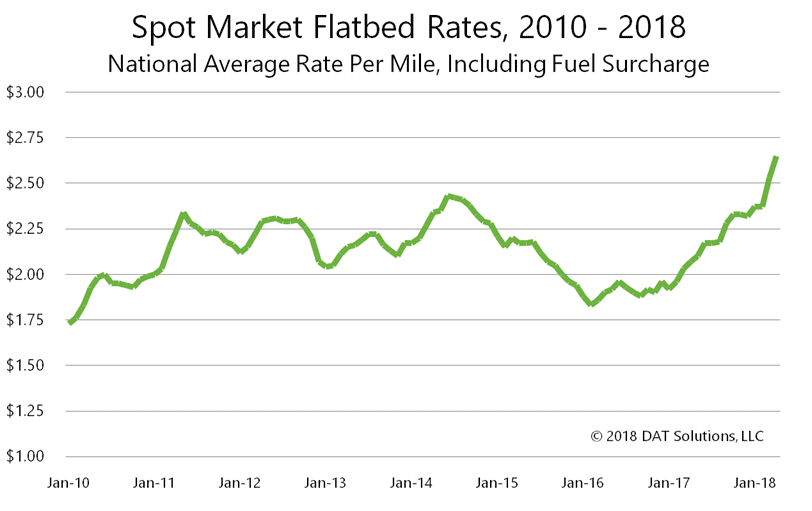
Flatbed rates are at record levels and have been on a steady climb for the past two years.
Capacity tightens
The flatbed load-to-truck ratio — which gauges capacity by comparing load posts vs. truck posts on DAT load boards — has exceeded 100 loads per truck for 7 weeks in a row. That’s unprecedented. The graph below show how dramatically the ratio has risen this year compared to the past two years. It’s literally off the chart.
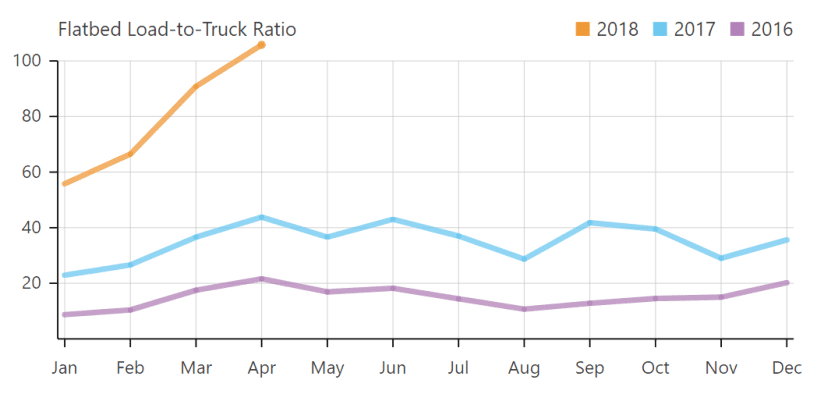
Flatbed load-to-truck ratios are literally off the charts, breaking the 100 loads per truck barrier in March. © 2018 DAT Solutions, LLC
Need Capacity? These 5 DAT Tools Can Help
What’s driving flatbed demand?
There are a number of factors driving flatbed demand. Here are some of the most significant ones:
Oil and energy
The oil and energy sector is a huge driver of flatbed demand. Much of that activity is centered in the Houston market. The top four flatbed lanes in the country originate or end in Houston:
#1. Houston market to Houston market
#2. Houston market to Midland, TX market (the Permian Basin)
#3. Houston market to Dallas market
#4. Dallas market to Houston market
Source: DAT RateView
The oil industry saw a huge downturn late in 2014 when oil prices dropped from over $100 per barrel (West Texas Intermediate crude, or WTI) to below $30 per barrel by February 2016. Oil production generally ramps up when prices hit the $45- to $50-per-barrel mark. Last week, prices topped $70 per barrel, and the U.S. pullout from the Iran nuclear deal could push prices even higher.
Oil and natural gas by-products also feed plastics production, which has added to a boom for the petrochemical industry along the Gulf Coast, intensifying flatbed demand even further. (I explained this longer-term trend in more detail in another blog post: How Natural Gas and Plastics Impact the Truckload Spot Market.)
Construction
Construction is another sector that depends heavily on flatbeds. As the graph below shows, total construction spending — residential and commercial — has been trending upward for the past 7 years.
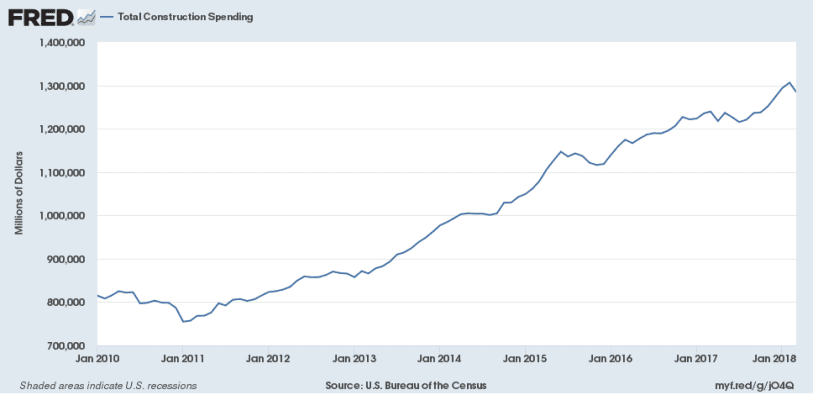
Construction spending has been trending upward since 2011.
Post-hurricane rebuilding has also added to pressure on flatbed capacity, as homes and businesses are rebuilt along the Gulf Coast, in Florida and in Puerto Rico. Several intrastate lanes in Florida are among the top flatbed lanes, which can be attributed, in part, to hurricane rebuilding efforts:
#15. Jacksonville, FL market to Miami, FL market
#17. Lakeland, FL market to Jacksonville, FL market
Automotive
Auto sales have dipped after hitting their peak in the fall of 2017, but they’re still a major source of flatbed demand to transport raw materials and parts, as well as finished goods.
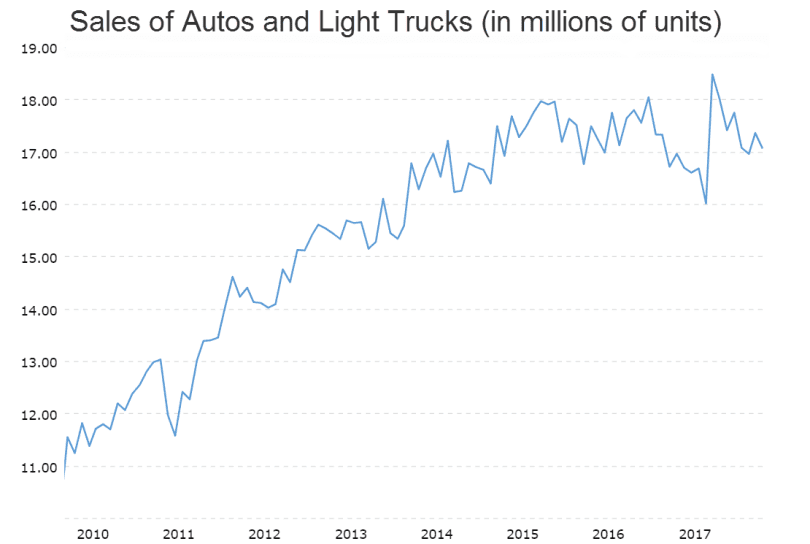
Source: Macrotrends
Cleveland is a major producer of steel and auto parts, and two lanes out of Cleveland show up in our top flatbed lanes:
#9. Cleveland market to Detroit market
#16. Cleveland market to Chicago market
ELDs and drivers
Electronic logging device requirements have also added to pressure on already-tight flatbed capacity, since the ELD mandate went into effect in mid-December. Flatbed fleets tend to be smaller than their van and reefer counterparts, and small carriers were the most likely to wait until the last minute to implement ELDs. Many are still adjusting their operations and schedules to accommodate electronic logs.
Finding drivers for flatbeds can also be challenging. Flatbed demand tends to be seasonal, and a flatbed driver has additional duties that are not required with other trailer types. Strapping down heavy equipment and tarping loads take physical strength and skill. Not every truck driver is qualified or willing to handle flatbed loads.
Want to see point-to-point spot market and contract rates for flatbeds? DAT RateView has rates for more than 65,000 lanes.