Demand continues to escalate for trucks equipped with dry van trailers, and capacity is still constrained, as we head into a seasonal peak in June.
Looking back a few months, we see that these trends began to accelerate in January. After facing severe pressure from the broad adoption of ELDs — which constrained capacity, created a large imbalance in the marketplace, and drove our DAT Dry Van Barometer to record highs — it appears that truckers in the dry van marketplace are beginning to adapt.
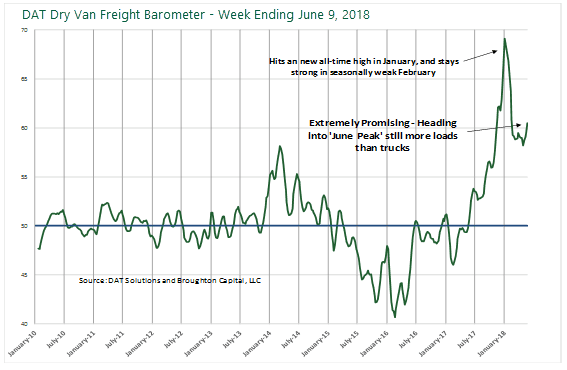
The capacity constraint produced by ELDs reached its worst point in February for dry van. Demand growth has stayed strong and is continuing to exceed capacity, but capacity is recovering as carriers are pre-planning a driver’s schedule out for the next 48 to 72 hours. The use of additional trailers and giving favorable treatment to customers, who allow loading and unloading of equipment without the truck (or driver) being present, is putting even small carriers on the road to asset utilization recovery.
We will continue to monitor this closely, and should point out that demand still exceeds capacity, even more than it did at the previous peak in 2014, however the improving asset utilization trend was equally significant until recently.
That the imbalance reached its peak in January, which used to be one of the slowest months for loads seasonally, isn’t lost on us. Since then, as dry van carriers have begun to recover asset utilization, the level of demand seasonally has been improving. Since the first week of May, we have seen the rate of incremental asset utilization slow and the seasonal demand for loads increase.
As the level of demand has increased faster than the capacity utilization has improved, the DAT Dry Van Barometer has started moving up again. We expect this trend to last at least through the end of June, given the normal seasonal patterns of demand.
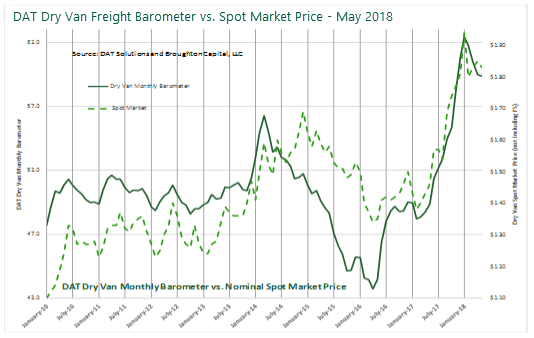
Historically the DAT Dry Van Barometer’s measurement of the balance, or imbalance, between capacity and demand has been highly predictive of both the direction and magnitude of changes in the spot price for dry van loads. You don’t have to be a mathematician to see the relationship, when the DAT Dry Van Barometer is plotted against the nominal change in spot price, on the above graph.
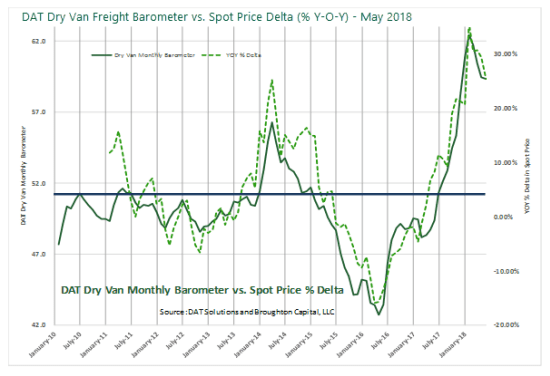
The historically tight fit between the DAT Dry Van Barometer and the spot price direction and magnitude becomes even more evident when plotted against the year-over-year percentage change. Knowing where the barometer is, and knowing where it is trending, are great indications of what pricing should be expected today and what pricing will be in the coming weeks and months.
Given the current level and upward trend in the DAT Dry Van Weekly Barometer, we find it easy to forecast steady, significant increases in contract rates that exceed 10% at least through the end of 2018. Bottom line, if you have or can find the truck, someone will be willing to pay you to move a load, and the rate that they are willing to pay should continue to go up for the foreseeable future.
Stay tuned…
Donald Broughton is a financial analyst studying the transportation sector and will be a keynote speaker at the DAT User Conference. Donald is Principal and Managing Partner at Broughton Capital. He discusses transportation stocks and other economic indicators regularly on CNBC.
What is the DAT Freight Barometer? Working with DAT’s data engineers, Broughton Capital has developed proprietary DAT Freight Barometers™ to accurately determine the current balance between capacity and demand. Each of these indices captures a number of marketplace factors, including number of loads posted and number of trucks posted in that time frame, as well as the number of loads and number of trucks searched for. Because the DAT database is so broad and deep, we assert that these barometers have predictive value in determining the magnitude and direction of both spot and contract market rates, as well as predictive value for the overall economy.