Recent freight patterns have shown peak demand in the second quarter of the year as opposed to the historical trend of a third-quarter peak. Yet here we are, well into the second quarter, and things are humming along nicely with plenty of available trucks in most regions outside the Southeast.
So what happened to the capacity crunch?
First, the economy is recovering but it’s hardly robust. Unemployment is coming down slowly, consumer spending only comes in bursts, and construction and housing still look troubled. Second, there’s capacity to be had in rail intermodal. Third, we avoided a disastrous spring in terms of disruptive weather.
It’s all added up to a bit of dullsville in the freight landscape.
Even high fuel prices are less disruptive. Diesel prices are lower than they were at this time last year, and the short-term outlook is that prices will fall farther. This means, thankfully, less pressure on small carriers that don’t adjust well to spiking fuel costs—and fewer bankruptcies.
Balance of Supply and Demand
Without capacity pressure, carriers aren’t getting the rate bump they typically expect this time of year. This comparison of per-mile linehaul rates (from DAT Truckload Rate Index, fuel surcharge removed) provides a snapshot as of publication date:
| May 2011 | May 2012 | Change | |
| Van | $1.33 | $1.36 | 2.3% |
| Flatbed | $1.73 | $1.73 | 0.0% |
| Reefer | $1.61 | $1.58 | – 1.9% |
[Note: The spot market (broker “buy”) rates noted in the table omit fuel surcharges of $0.50 for van, $0.54 for flatbed and $0.52 for reefer. With the surcharge added, the total rate would be $1.86 for van, $2.27 for flatbed and $2.10 for reefer, as a national average. This comment was added to the blog on May 17 at 2:15 PM Pacific.]
Things can change quickly on the spot market. Vans had been lackluster in the first quarter with a linehaul rate averaging $1.28. Rates are trending up now but with a load-to-truck ratio of around 3.0 nationwide, there is still plenty of van capacity in most places around the United States. (Load-to-truck ratios are derived from postings on the DAT Load Boards; a range of 2.5 to 3.0 is considered neutral).
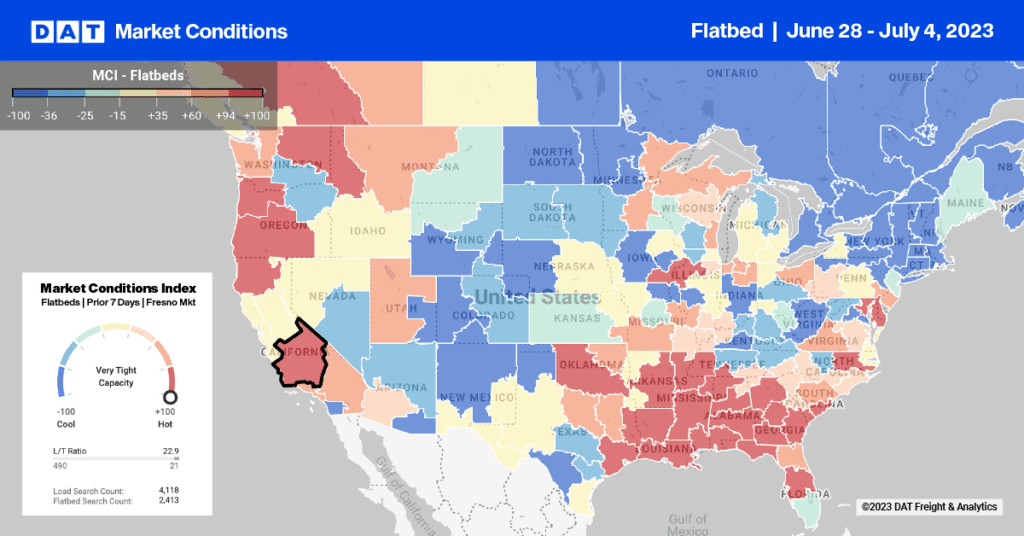
For flatbed freight, movements were robust in the first quarter, with favorable weather helping freight to move “ahead of season.” Perhaps this early season shipping has led to the lull in the second quarter. Although flatbed linehaul rates are now near their 2011 peak, there’s no apparent pressure to push rates much higher.
Finally, refrigerated freight is a real puzzle. Favorable weather early in the year helped to nurture good volumes and rates out of California, Florida, and the Deep South, yet overall reefer rates are still 2% lower than they were last May.
One theory involves a spread-out harvest season. Farmers in northern states like Michigan, Minnesota, New York, Pennsylvania, and Wisconsin planted late due to unseasonable cold. Also, drought has hurt some areas. Demand is not as concentrated as it might be otherwise. Yet refrigerated carriers I’ve spoken with remain optimistic about this shipping season.
So maybe the big story in freight capacity is that there isn’t a story. Supply equals demand. Which may be just what we really need as businesspeople.
Added on May 17 at 5:40 PM Pacific:
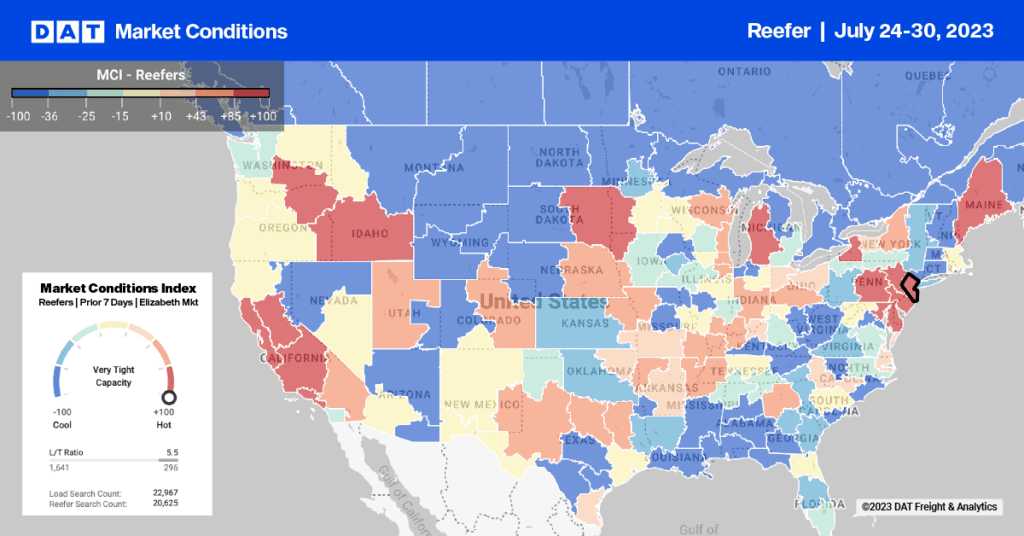
There were quite a few comments about high rates in the Southeast, and I wanted to offer a snapshot from our Hot Market Maps, a feature of DAT 3sixty Power Load Boards and Truckload Rate Index. You can see on the map that markets in the Southeast have the darkest color, which is associated with a load-to-truck ratio of 5.7-to-1 and above. That means that for every truck posted on the DAT Load Boards in those regions there are about six available loads, on average. In the lightest-colored areas, by comparison, trucks outnumber loads.
Major markets that are “hot” include Atlanta, Charlotte, Memphis and Phoenix. Cold markets are L.A., Chicago, Columbus, Minneapolis, Buffalo, Pittsburgh and Elizabeth NJ. Philadelphia and Dallas are neutral.
When there is high demand, as there is now in the Southeast and in Phoenix, it exerts pressure on rates, but this can be a seasonal spike. The short-term pressure has a big impact in that region during that season, but it may not affect the national average very much. I will blog some more in the next few days about the relationship between demand and capacity, and how that can affect rates. Meanwhile, I appreciate your comments, whether you agree with me or not! it’s a great discussion.