As truckload demand shifts across the country, some of the lanes that were paying headhaul rates just a few weeks ago have turned into backhauls for the spring season. Those shifts also create new opportunities elsewhere, but the bottom line is that one-way rates don’t offer the full picture.
We’re defining “headhaul” as the higher rate in a pair of moves. If you’re offered a rate that seems unusually high, use a tool like DAT RateView to do a quick survey of market rates and the load-to-truck ratio for the return trip. Does it look like you’re going to have to deadhead for your next load? If so, are you getting paid a high enough premium on your headhaul to ease the pain of those empty miles?
Florida is the classic example of how seasonal demand can flip lane rates. Take a look at a 13-month history comparing reefer rates for the lane from Atlanta to Miami and the return trip from Miami to Atlanta:Broker spot market frieght rates derived from DAT RateView
For 11 months of the year, Miami is the backhaul on an imbalanced lane. When reefer demand spikes in Florida during produce season, the lane flips and the southbound direction becomes the backhaul.
Reefers compete with vans when refrigerated freight availability is low. At peak harvest times, all the reefers are busy, so van rates also rise. Hence, the Southeast enjoys higher rates in the spring and early summer, as produce and construction season start sooner. The Midwest and Northeast have higher rates in the fall.
Preparing for the Unexpected
MORE ABOUT FREIGHT RATES
Under normal circumstances, outbound rates are higher in Los Angeles than inbound rates. That’s due in large part to the mega-port of L.A. and Long Beach. When an ongoing labor dispute paralyzed West Coast ports, however, the normally slow season of January and February ground to a halt. For a few weeks, van load-to-truck ratios in Los Angeles fell to less than one load per truck. As a result, rates for freight entering L.A. were higher than rates coming out, as truckers were paid a premium to enter what had effectively become a dead-end freight market. L.A. is bouncing back, as a new labor agreement has the ports working through the backlog of freight that collected at the port.Load to truck ratios out of Los Angeles. January and February are both rounded up to 1.
Here’s a look at some other lanes in which the headhaul shifts or the freight demand moves from highly imbalanced to balanced:
Reefer rates on the L.A.-Stockton lane swing from highly imbalanced into balance. Stockton to L.A. rates doesn’t often hit L.A. to Stockton levels, but they do improve in the fall. The current drought in California could affect produce leaving Stockton this year.
Houston is the largest flatbed market by volume, but as steel and auto-related cargo take over leadership in growth, the focus is shifting. Cleveland shows the biggest increase in outbound volumes.
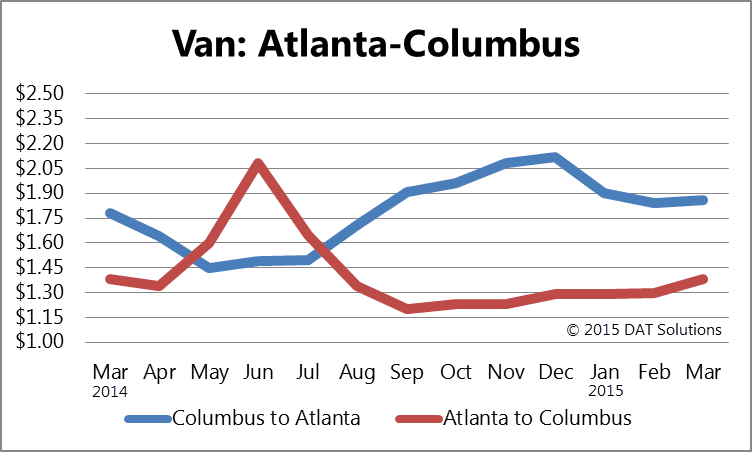
For volatility, Columbus to Buffalo has more swing than any other popular lane, but Columbus stays the headhaul origin. Not so in the case of Columbus to Atlanta, which becomes a backhaul lane in the summer months.
To learn more about DAT RateView or request a demo, please contact our award-winning customer service team at 800.551.8847 or complete this online form.