Two weeks ago, I noticed an upward trend in the Los Angeles market, where the load-to-truck ratio climbed from fewer than one load per truck in prior weeks to 1.7 on Wednesday. In two more days the ratio more than doubled, to 3.7 on Friday, September 28.
Note that L.A. market includes not only the City of Angels itself, but the surrounding area, and encompasses two major, deep water ports in Los Angeles and Long Beach. (See map, below.) I track weekly rate trends in the top 12 U.S. van freight markets, including a few hundred representative lanes from our DAT Truckload Rate Index database of more than 12,000 spot market lane rates.

The Los Angeles freight market includes L.A., Long Beach and several smaller cities that have similar characteristics, from the perspective of the transportation industry.
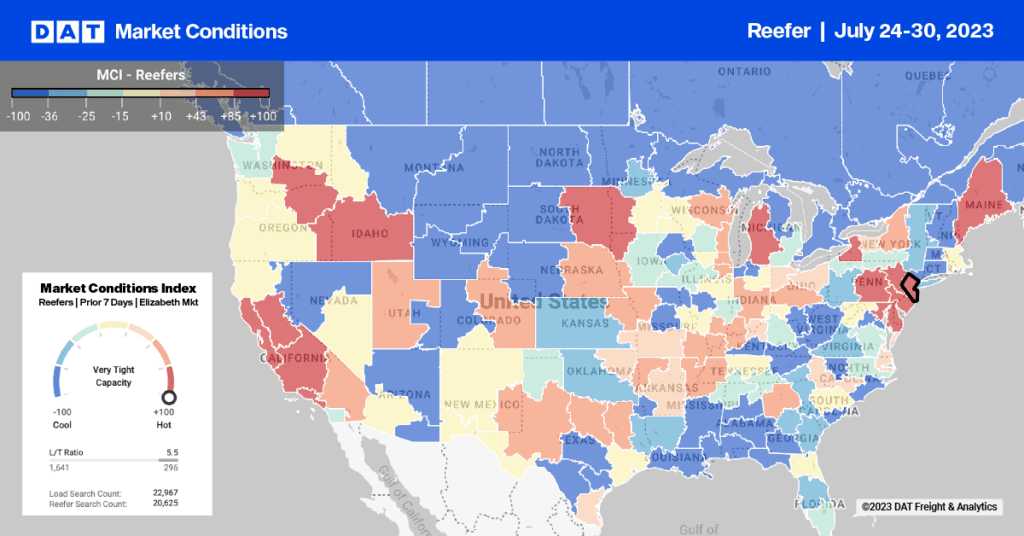
That Friday happened to be the last business day of the third quarter, so a lot of indicators were rising. I fully expected them to fall again on Monday, with the start of a new month. On October 1, in fact, the ratio did slip back down, but it rose again that Friday to 3.8, as diplayed in the detail from DAT Hot Market Maps, below.

On Friday, October 5, the load-to-truck ratio hit 3.8 in the Los Angeles market, which includes the ports of L.A. and Long Beach. This was a big change from previous weeks, and was due to a surge of exception freight designated for vans. The timing of the spike indicates imported goods arriving from Asia for the Christmas retail season.
Now we are in the third week, and outbound truckload rates are rising steadily for vans from L.A. The first rates to rise were the long haul rates to Harrisburg, PA and other distribution points in the East. A few days later, the medium haul rates rose to the Midwest. I expect shorter-haul rates to Phoenix, Seattle and Stockton to follow the trend in the coming week.
The conclusion? As the old song says, “it’s beginning to look a lot like Christmas.” Imported goods are arriving from Asia, and retailers move them to distribution centers across the country, in time for the holiday season. In a typical supply chain, the longest hauls are prioritized first, so when there is a time crunch in November, only the nearby West Coast warehouses remain to be filled, within range of a 1- or 2-day trip.
Los Angeles is a great market to watch, because it remains an excellent indicator of seasonal freight. Look for the upward trend in rates, to see how long the higher rates last, and whether they exceed the seasonal uptick from the prior year. If the upward trend is sustained at a higher level, then monitor shippers’ contract rates in the same lane to see whether they follow the trend. At this point, it looks like a normal, seasonal increase that will not affect most contract rates. Some exceptions do arise, however, so I will be watching those lanes closely.
In future years, when the Panama Canal project is complete, more freight from Asia is expected to bypass California, reaching the East Coast via Panama. For the time being, however, the largest ships can’t pass through the Canal, and about 80% of shipments from Asia enter the U.S. at the ports of L.A. and Long Beach.


