In the first half of the year, the spot market in Texas was boiling over, with not nearly enough trucks to cover the growing demand for freight. In the past month, the market’s been pretty tepid.
What happened?
Pipeline capacity issues in West Texas are part of the explanation. Drilling in the Permian Basin around Midland, TX, has slowed. Demand also cooled out of Houston, the largest flatbed market in the country and the top market supplying Midland and its surrounding counties. Regional van markets like Dallas and Memphis—which send freight to Houston—seem to be impacted by the slowdown in oil drilling as well.
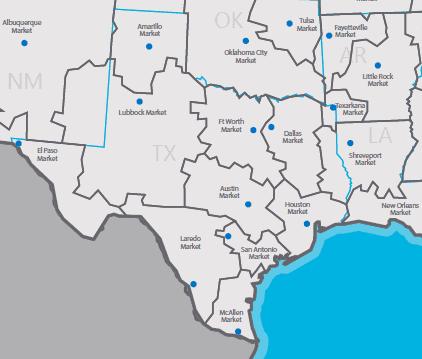
DAT tracks daily load-to-truck ratios in 11 Key Market Areas in Texas, more than any other state. To see daily load-to-truck ratios in 135 Key Market Areas, get the DAT Power load board or DAT RateView.
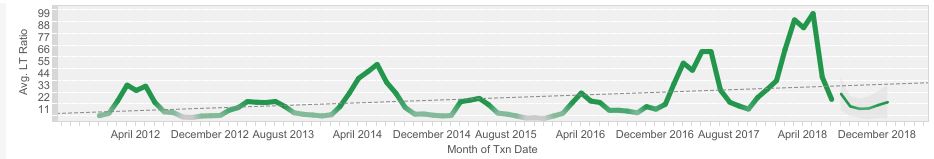
Houston market load-to-truck ratios from 2012 to present.
This slowdown put a bit more capacity on the spot market during early August, as trends looked slightly subpar compared with normal seasonality. We usually see a slump in freight from mid-July to mid-August, but this year, even though rates stayed mostly high nationwide, Texas freight markets fell more than most.
At this time, the inability to quickly pipe oil to the Gulf Coast and other markets creates a glut in the Permian Basin, which brings down prices. Looking ahead, even though drilling activity has slowed in the region, new pipeline projects are underway to expand capacity for all the completed wells.
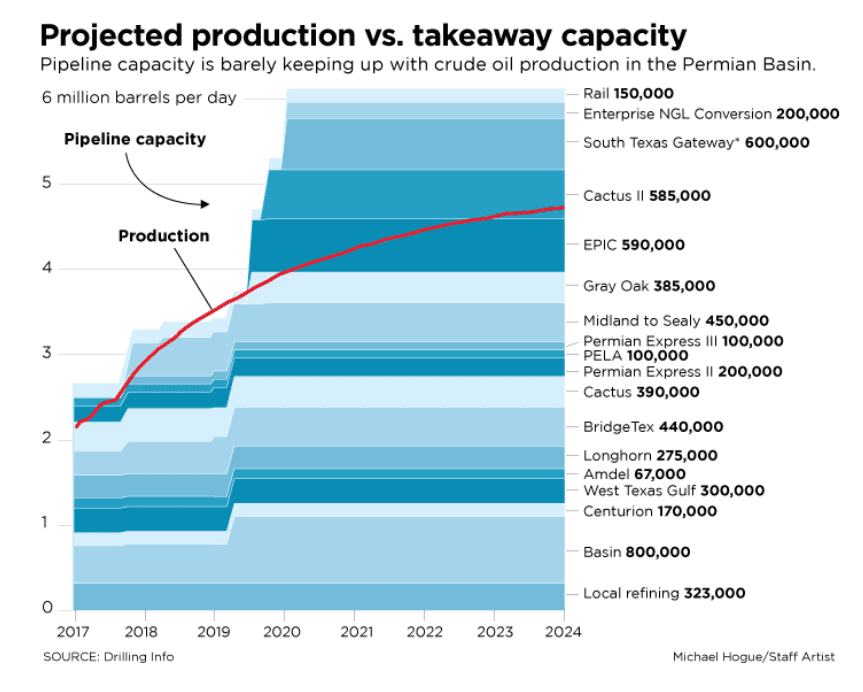
In the Permian Basin, pipeline capacity is barely keeping up with production, as seen in this graph from DallasNews.com.
New pipeline projects underway
A number of pipelines have been completed or expanded already in 2018, and more are coming in 2019. One of the issues these projects face is sourcing steel domestically due to the new steel tariffs. Some claim that the steel isn’t readily available or costs much more than imported steel prior to tariffs.
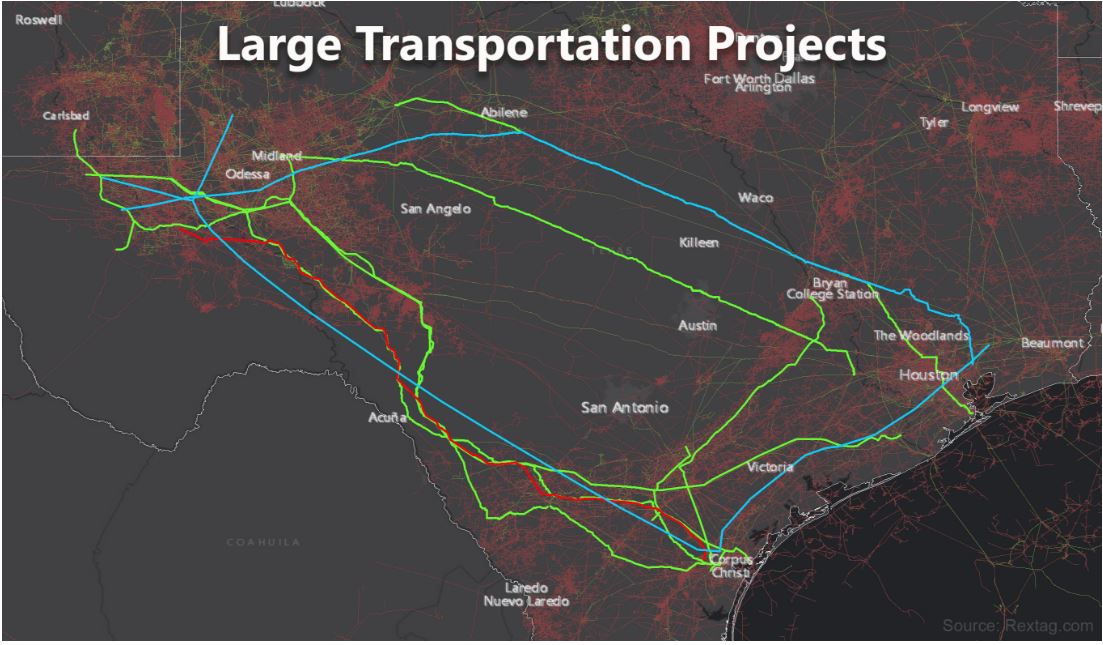
The map above shows large pipeline projects that are expected to completed in 2018-2020. Map from DrillingInfo.com.
Other areas in the U.S. have shown higher flatbed activity, including the Cleveland market, Decatur, AL, (a perennial hot market) and more recently, Roanoke, VA, where flatbed prices spiked last week. While recent spot prices have trended down, longer term flatbed contract rates are up, rising from $2.04/mile in August 2017 (excluding fuel surcharge) to $2.30/mile in August 2018 on a nationwide basis.
It’s yet to be seen whether this new domestic activity outweighs the West Texas slowdown. Also, stronger seasonal van and reefer trends are tightening many western markets. One thing we can count on is that change will continue to take place in the U.S. economy. These trends will continue to be captured in DAT’s databases.
Find loads, trucks and lane-by-lane rate information in DAT load boards, including rates from DAT RateView.