If you read our weekly e-newsletter Trendlines, or follow daily load-to-truck ratios in DAT RateView, you may have noticed this: flatbed demand is skyrocketing.
While the average load-to-truck ratio in April was 3.5 for vans and 6.6 for reefers, the flatbed load-to-truck ratio was 43.7 loads per truck! That’s the highest monthly load-truck-ratio we’ve seen in years.
Load-to-truck ratios measure the number of load posts on DAT load boards versus the number of truck posts. The load-to-truck ratio is a good indicator of supply and demand, and a rise in the ratio often signals a rise in rates. In fact, national average flatbed rates, excluding fuel surcharge, are up 17¢ per mile year over year.
Load-to-Truck Ratio Doubles Y-O-Y
Flatbed demand has increased 102% year-over-year and has been on a steady climb since August 2016. To put the 43.7 loads per truck in perspective, as you can see from the graph below the highest monthly load-to-truck ratio in 2015 was 22.8, and in 2016 it hit 21.6. Demand is usually highest in late Spring/early Summer so the ratio could still move higher this year.

The flatbed load-to-truck ratio has been on a steady climb since August of 2016.
You may be wondering what’s causing this usually high demand for flatbeds. Here are a few of the key drivers of demand:
Oil, natural gas, and plastics
These three products are interrelated and contribute to the high demand for flatbeds, especially along the Gulf Coast. Natural gas is a by-product of the fracking/oil production process and, until recently, low domestic prices and lack of infrastructure meant that the gas was often flared off. Higher international natural gas prices have led companies to convert the gas to its liquid form (LNG) and export it.
Natural gas and oil by-products also feed into plastics production, which has led to a building boom for the petrochemical industry along the Gulf Coast. See our blog post How Natural Gas and Plastics Impact the Truckload Spot Market.

Wind Energy
Fossil fuels aren’t the only energy source boosting flatbed demand. There are now more than 50,000 operating wind turbines in the United States. A utility-grade wind turbine has more than 8,000 parts. And while some parts are small enough to be transported in dry vans, the big stuff—blades, towers, and the turbines that turn the blades—require flatbeds for transport.
The map below shows where the largest parts of wind turbines are manufactured. As you can see, Texas is a hotbed of activity for wind energy manufacturing. Along with oil and natural gas production, wind energy adds to the huge demand for flatbeds in Texas. It’s no surprise that Texas has the top three markets for spot market flatbed freight in the country: Houston, Dallas and Fort Worth.

Manufacturing locations for the largest components of wind turbines: blades, towers, and turbine assemblies that turn the blades. Source: American Wind Energy Association.
Construction
Construction has always been a major source of flatbed freight. Lumber, steel and other construction materials move on flatbeds. Residential construction, commercial construction, and state and federal infrastructure projects all contribute to demand. According to the most recent numbers from the U.S. Census Bureau, sales of new single-family homes increased 15% from March 2016 to March 2017, rising from 537,000 to 621,000.

New residential home sales have risen 15% in the past year.
Automotive
Last year was a banner year for auto sales. Sales of new cars and light trucks hit 18.3 million units in December 2016. Although sales have dipped in the first months of 2017, the auto industry has seen year-over-year increases for seven straight years. Many of the raw materials—as well as the finished vehicles—are transported on flatbeds.
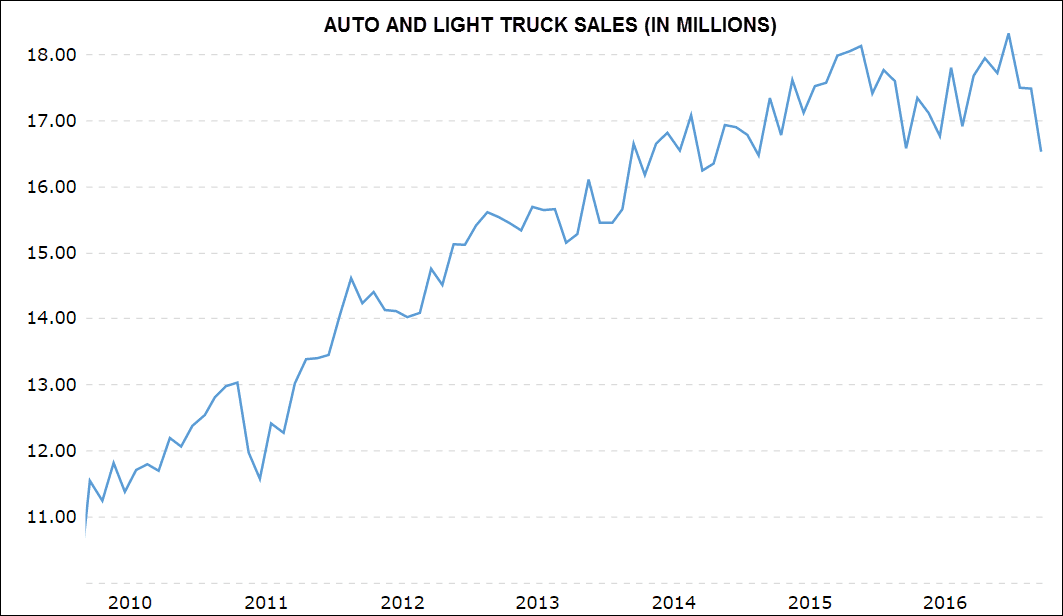
Sales of autos and light trucks have experienced year-over-year highs for seven straight years, reaching 18.3 million vehicles in December 2016. Chart courtesy of Macrotrends.
To see national load-truck-ratios each week, check out our Trendlines newsletter. To see daily load-to-truck ratios in 135 Key Market Areas across the country, use DAT RateView. For more information about DAT RateView, send us an email or call 800-547-5417.