The November storm that buried Buffalo, NY, disrupted supply chains for days. (Photo used with permission. Flickr: GovernorAndrewCuomo)
A November storm that brought more than five feet of snow to Buffalo, and sub-freezing temperatures to other major freight markets, revived unpleasant memories among transportation and logistics professionals.
Last winter’s Polar Vortex paralyzed broad sections of the country from December through March. Recurring storms immobilized trucks and drove rates way up during the first quarter of the year, traditionally a slow season for freight. This year, a number of factors could make a harsh winter even worse.
Demand is up this year – An increase in freight volume is good for the transportation industry, but the extra demand can lead to extra disappointment when the weather immobilizes fleets. The economy is expanding, as indicated by a 3.9 percent increase in GDP in the third quarter, according to the U.S. Department of Commerce. More freight is on the move, and the American Trucking Associations reported a 3.2% increase in for-hire truck tonnage from January through October, compared to the same period last year. Likewise, load posts on DAT Load Boards have increased 49 percent in 2014 to-date, versus 2013. Spot market rates are about 10% higher this year, as well, so if rates rise again this winter, they’ll be starting from a higher floor.
Capacity is not meeting the challenge – Truck capacity has not kept pace with the growth in demand. The ongoing driver shortage prevents many fleets from adding trucks, even when business is booming. According to the Journal of Commerce Truckload Capacity Index, capacity has expanded in 2014 among the largest fleets, but they still lag 17% to 18% below pre-recession levels. Regulations have further tightened capacity, especially the Hours of Service (HOS) rule change of July 2013. The new HOS has reduced fleet productivity by an estimated 3 to 5 percent.
Backlog continues at West Coast ports – The Journal of Commerce reports that containers continue to pile up at West Coast ports, and terminal operators are unable to clear the backlog. Contract talks continue between the labor union and management for all seven West Coast ports in the U.S. and Canada. Approximately 40% of import container volumes entering the United States flow through the twin ports of Los Angeles and Long Beach, so any disruptions could cause ripples throughout the supply chain.
All these factors have prompted shippers to rely more on brokers and 3PLs to insure they have capacity when they need it. Consultancy Armstrong & Associates projects that 3PL revenues will increase from 10.8% of total logistics costs in 2013 to 11.2% this year.

Load-to-truck ratios were below 2.2 in much of the country during the first quarter of 2013. The Hot Market Map above reflects a typical winter lull in truckload freight movements, under ordinary seasonal weather conditions.
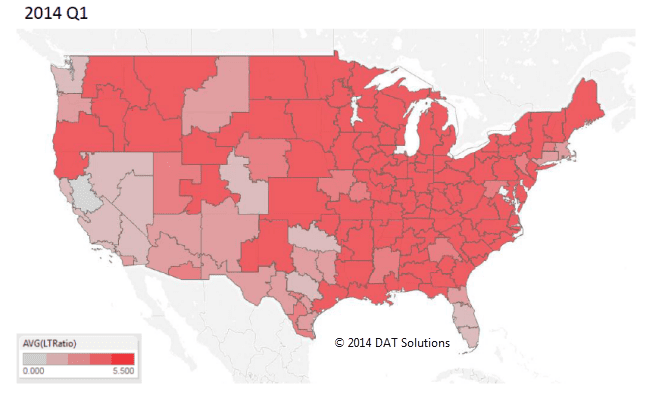
The Polar Vortex wreaked havoc on truckload freight transportation in the first quarter of 2014, however, turning the Hot Market Map red throughout most of the U.S. Only the Southwest and Florida were unaffected by the extreme weather that snarled supply chains and hampered fleet productivity.
4 Ways to Find Capacity, Even in a Snowstorm
Here are 4 tips to help you find trucks when capacity is tight.
Use your TMS – Check your company’s Transportation Management Software to see what loads your brokerage is currently moving. There may be a truck completing a delivery near your current load’s point of origin. If not, check your TMS for reliable, qualified carriers who have trucks in the area.
Think local – During a major snowstorm or other unpredictable event, you may need to use a carrier you’ve never worked with before. If you need to move a load to a certain location, search for carriers who are based there and are likely to need loads that get their drivers home. The DAT Directory, available in all DAT Load Boards, will show you where a carrier is domiciled. DAT Power load board users can also check the LaneMakers tool for carriers who frequent specific lanes. Once you identify a carrier, validate that company’s DOT authority, insurance coverage details and safety rating in minutes with DAT CarrierWatch®
Reach drivers on the road – Truck drivers don’t sit at a desk during the day. You can reach them in the cab, waiting to be unloaded, while they check their smartphones for a return load. Post your load to the DAT Extended Network, to reach the 110,000 drivers who have downloaded DAT’s mobile app. When company drivers see your loads, they alert their dispatchers, and then your phone will start ringing.
Post a rate when you post a load – Nothing gets a carrier’s attention faster than a good rate per mile. Many brokers prefer not to include the rate when posting on a load board, but if you’re in a rush, your competitive rate will attract carriers. Check DAT Rateview™ to see how your rates compare to the current market rate in each lane.