Trends sometimes get lost in the national picture so I decided to take a look from another vantage point. DAT RateView has a window on regional rate changes that can be scaled from 1 day to 1 year. For this exercise I thought of comparing the last 7 days versus the prior 90 days. The results were pretty amazing-
From West to East rates have been climbing this fall. The above chart shows four regions in the West shipping to six regions in the East. In nearly every case rates are up by six cents per mile or more. DAT has defined 15 pricing regions in the US and three more in Canada. The 15 US regions define 225 pairs (15 x 15). Running this exercise found 64 pairs where rates had jumped up at least 6 cents a miles versus just 27 pairs where rates had dropped 6 cents a mile.
The reason this result may surprise in that in the recent past fall freight peaked in September and October. Yet 2016 has been unusual in that ‘normal’ patterns don’t seem to apply. For example, there is usually a peak for van freight in June followed by a fall off of activity after the 4th of July. That peak was muted this year but neither did freight fall off in July in DAT’s spot market data. This year we are several days into November and there is no sign of a ‘fall off’ of activity, instead the freight economy looks like it is heating up in our data.
What’s clear is that this is a phenomenon of west to east with California, the Pacific Northwest and Rocky Mountain states’ activity pushing rates higher into all the other regions of the US. Also present in DAT’s data is that Canadian- to-US rates continue to rise seasonally, while US-to-Canadian rates are falling except for rates from the southern Rocky Mountain states.
If you are a shipper or broker moving freight in the eastern half of the US, you may not be seeing much rate movement. There are some select areas like the Great Lakes region to the Upper Midwest where rates are actually down six cents per mile in the last week. Overall, the rate trend is upward and has been on a climbing trajectory for the past several months.
Measured at the national level for trips over 250 miles, spot market van rates are up 8 cents in November over their October averages. Rates have climbed 17 cents per mile since the low point in April (excluding fuel surcharge calculation). If you include the fuel surcharge to look at the total rate, rates have recovered 23 cents to surpass November by 2 cents [verify on Monday]. We saw this coming and earlier at the DAT User Conference [October 17-19] presented these factors as driving rates- 1. Strong produce harvest with declines from California being offset by strong numbers elsewhere. 2. Hanjin bankruptcy resulting in supply chain disruption and increased amounts of stock transfers. 3. Weather events, including flooding in Louisiana and the Carolinas which create ongoing demand for reconstruction freight and relief supplies. Probably a 4th factor is the overall economy continues to show a slight path of improvement according to data from ISM and others.
The DAT Regional Definitions
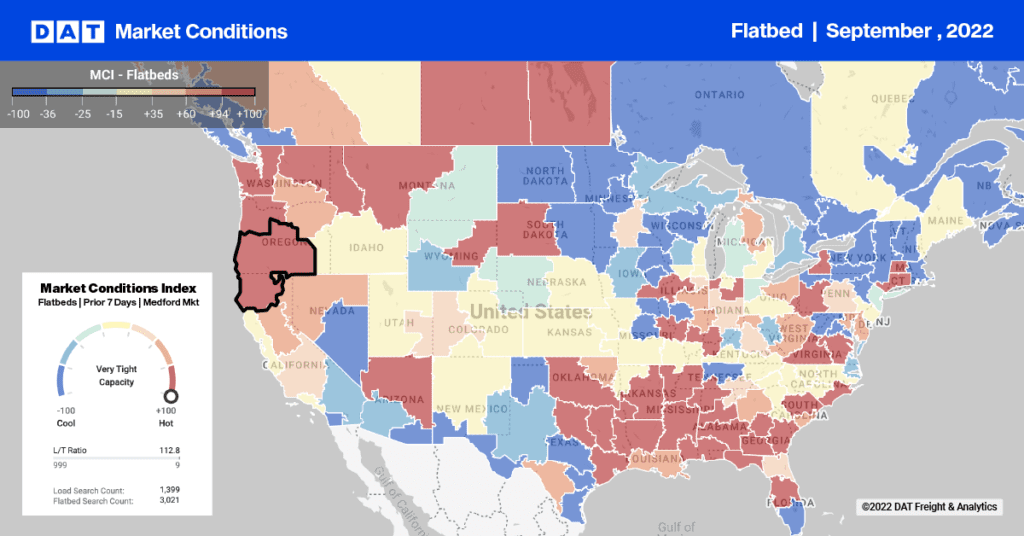
A look at flatbed freight showed very mixed results. The number of flatbed regional pairs showing increases remains closely balanced with the number of pairs showing declines. Flatbed freight has been in decline since the end of the fracking boom in early 2015. Now with oil production leveling from declining, flatbed freight also shows signs of stabilizing.
Refrigerated freight meanwhile shows signs of a late push. On November 4th, the spot market reefer average was $1.96/mile, the highest it has been since June. Strong harvests of potatoes from southern Idaho, of apples from Washington’s Columbia Valley and western Michigan, have been joined by decent volume of iceberg lettuce from the Westside District in the San Joaquin Valley and Imperial Valley near Yuma, AZ. Even strawberries from Santa Maria to Watsonville continue to be harvested along with California grapes.
In short, the US freight picture looks strong for early November.
DAT RateView subscribers can duplicate these results, by running two views of the data, then comparing them in a third spreadsheet.