The load-to-truck ratio is an often overlooked – but surprisingly powerful – feature of the DAT Load Boards and DAT Truckload Rate Index. Use this demand indicator to predict rate changes in your markets and lanes, and adjust your pricing accordingly.
Here are the three steps that can alert you in advance to upcoming changes in spot market (broker “buy”) rates for truckload freight:
1. Research demand and capacity patterns in your markets
2. Watch for changes in the spot market load-to-truck ratio
3. Track the impact of demand and capacity changes on spot market rates
You can also use your new understanding of spot market rates to predict (or even influence) trends in your shipper customers’ contract pricing, usually two or three months in advance.
Step 1 – Research demand and capacity patterns in your markets
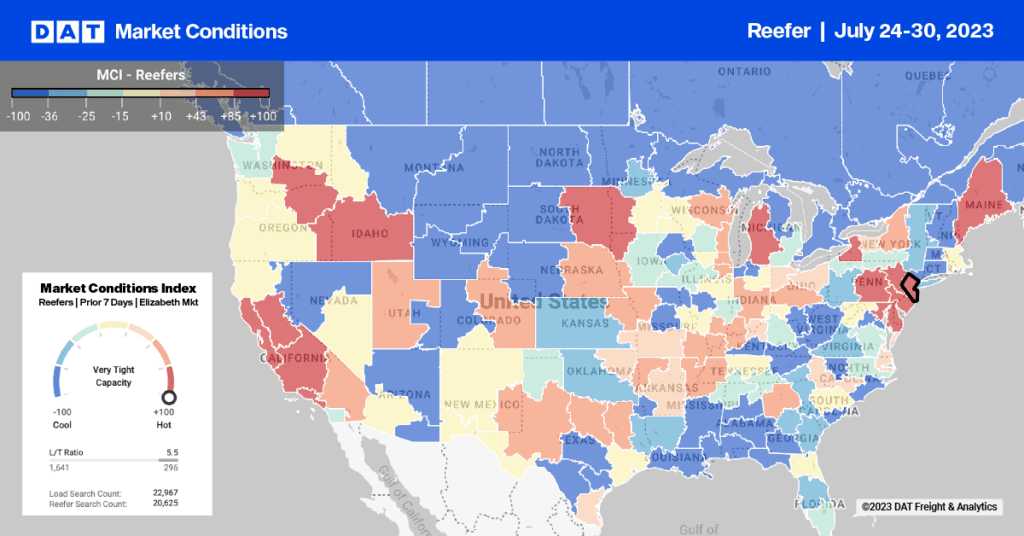
The spot market load-to-truck ratio is a sensitive indicator of demand and capacity – and eventually pricing. DAT Load Boards display load-to-truck ratios by state and by market, for each of the three major equipment types: van, refrigerated (“reefer”) and flatbed.

Figure 1 – The load-to-truck ratio is a sensitive indicator of demand and capacity that helps you to predict a change in rates. Click on the “L/T Ratio” button in the search or post screens of DAT Load Boards.
The load-to-truck ratio represents the number of freight loads posted on DAT Load Boards, divided by the number of truck posts. Brokers typically post loads more often when trucks are hard to find. Carriers generally don’t like to post trucks, either because they don’t have time to handle incoming calls or because they feel that it puts them in a weaker negotiating position. Whatever the reason, carriers tend to search for loads about eight times as often as they post trucks. With millions of load and truck posts, a change in the load-to-truck ratio signals a change in load availability or a relative lack of trucks. It can alert you to increased demand, say, for outbound vans in Albuquerque, which recently had a very high load-to-truck ratio. (Hint: brokers are often willing to pay more when the load-to-truck ratio is high.)
Areas of high demand relative to capacity can be identified easily on a map. The best example is DAT Hot Market Maps, which can be seen in DAT 3sixty Power Load Boards and DAT Truckload Rate Index. Hot Market Maps display 135 key market areas (KMAs) in the U.S. and 12 in Canada, as shown in Figure 2. The KMA is usually made up of a major city plus a selection of smaller, nearby cities, which together behave as a single freight market. For example, Long Beach is part of the L.A. market, because they are both population centers with large sea ports, but nearby Ontario CA is considered a separate market because it includes agricultural areas, warehouses and manufacturing facilities, as well.

Figure 2: This Hot Market Map, as displayed in DAT Truckload Rate Index, depicts the load to truck ratios for each of 135 key market areas (KMA) in the U.S. and 12 in Canada.
Step 2 – Watch for changes in the load-to-truck ratio
We track weekly rate trends in the top 12 U.S. van freight markets, including a few hundred representative lanes from our database of more than 12,000 spot market lane rates.(We also track rates and other trends for reefers and flatbeds, but I’ll stick with vans in this example.)
At the end of September and into early October, the Los Angeles market exhibited an upward trend in the load-to-truck ratio, which climbed from 0.7 loads per truck on Monday to 3.7 on Friday. (See Figure 3, below.) Friday was the last business day of the third quarter, so it wasn’t a surprise to see a surge in freight. On the following Monday, in fact, the ratio was back down, but only to 1.7 – much higher than the previous Monday’s ratio. On the second Friday, the ratio rose again to 3.8.

Figure 3 – The load-to-truck ratio for vans in the L.A. freight market climbed at the end of September, to close the quarter on a high note. The following week, this demand indicator surged again.
By the third week, outbound rates were rising steadily from L.A., following on the heels of the load-to-truck ratio. The first rates to rise were on the lanes to freight distribution hubs to the East, including Phoenix, Chicago, Indianapolis, Atlanta and Harrisburg PA, as well as to the North: Sacramento, Reno and Seattle. In the next week, the rates to Atlanta held steady while rates climbed farther on lanes from L.A. to Las Vegas, Denver, Dallas, and the East Coast centers in Memphis, Boston and Elizabeth NJ.
In most of these lanes, the current rate was above the 365-day average, but it was not markedly different from the rate at this time last year. The big exception here is Memphis. (See Figure 4, where the spot market rate history is represented by the brown line on the graph.) The spot market rate from L.A. to Memphis was a full 15 cents higher last month than it was in September 2011, and it went up another two cents in the past 10 days. Expect contract rates to rise on the lane from L.A. to Memphis, and perhaps on the back haul as well, when shippers renew their carrier agreements for 2013. This reflects the increasing importance of Memphis as a regional freight hub for truckload as well as LTL and parcel freight.

Figure 4: Spot market rates on the lane from L.A. to Memphis (brown line on the graph) were up 15 cents last month, compared to September 2011, signaling a likely increase in shipper contract rates on that lane in 2013.
On the other hand, rates from L.A. to Chicago trended up for one week, then headed back down. This lane was priced 15 cents lower in September than it was in the same month last year, and a two-cent rate increase in line haul during the first week of October was not sustained. I can see that when I adjust the slider in the upper right corner (Figure 5, below) from 7 days, with an average rate of $0.96 (down three cents from September) to 15 days, which captures a rate spike two weeks ago that brought the average rate up to $1.01 per mile, plus $0.51 for fuel.

Figure 5: Lane rates from L.A. to Chicago rose in the first week of October, then fell again. Rates in September were 15 cents below the average for the same month in 2011, so don’t expect shipper contract pricing to rise on this lane next year.
For additional detail on using this and other tactics to predict contract rates as well as spot market rates, I refer you to our recent, 45-minute webinar: “How to Anticipate Contract Lane Rates in 4 Easy Steps.”
For product information, visit the web pages for DAT Truckload Rate Index or DAT Load Boards.