
For brokers, margins are the name of the game. You’ve got to price loads so shippers are happy to work with you, while keeping enough wiggle room to pay carriers and profit yourself. It’s a difficult needle to thread.
Advanced analytics tools like RateView make it easy, though.
RateView is a powerful benchmarking tool based on 1,200 contributors and $150B of transactions across every lane.
Head to rateview.dat.com. Select a lane and adjust the slider bars to change the geography or timeline of the “best fit” rate. It is important to note that to display a historical rate, DAT needs contributions across at least three different companies with seven different contributions. The number of reports and companies contributed for a given lane will be displayed in the upper right.
Below is a snapshot of the spot pricing data from the Dallas market to the Chicago market over the past year, as well as the past seven days. The dot represents the average price in a given month. The bottom dash represents the price at the 25th percentile and the top dash represents the price at the 75th percentile.
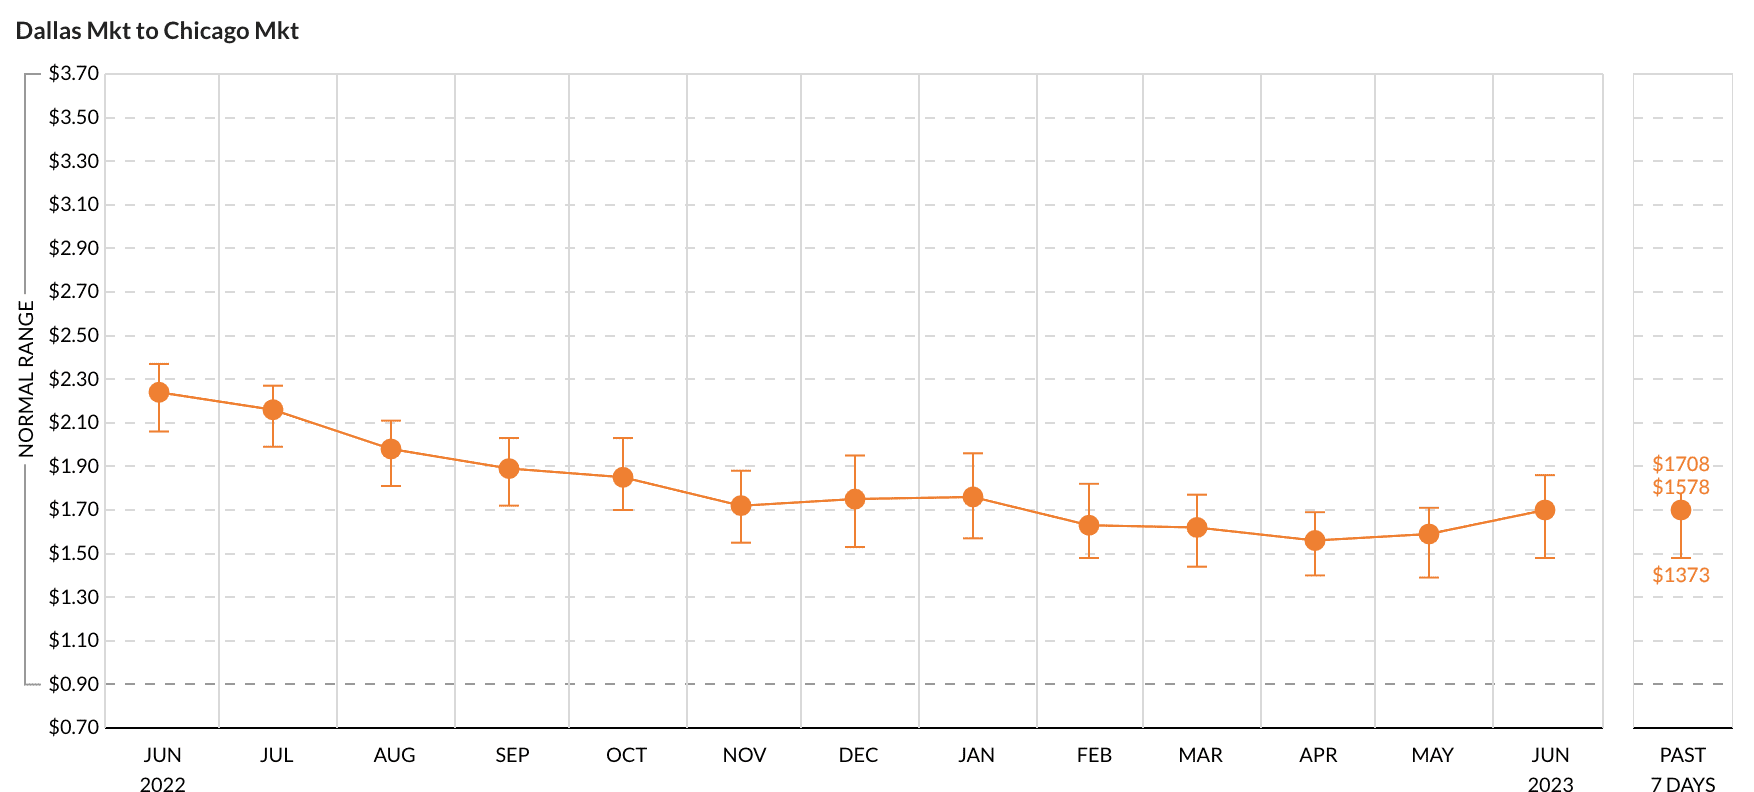
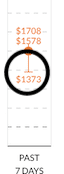
We also see that the average rate over the last seven days is extremely close to the 75th percentile of all contributed spot prices. This indicates that there are a few high prices for this lane pulling the average up, and that the majority of pricing activity is actually occurring between the average and the 25th percentile. While there are a number of other factors to include (market tightness, time of day or week, etc), the data suggests there is a good chance that a brokerage can pay a carrier between $1,578 and $1,373 for this load on this lane.
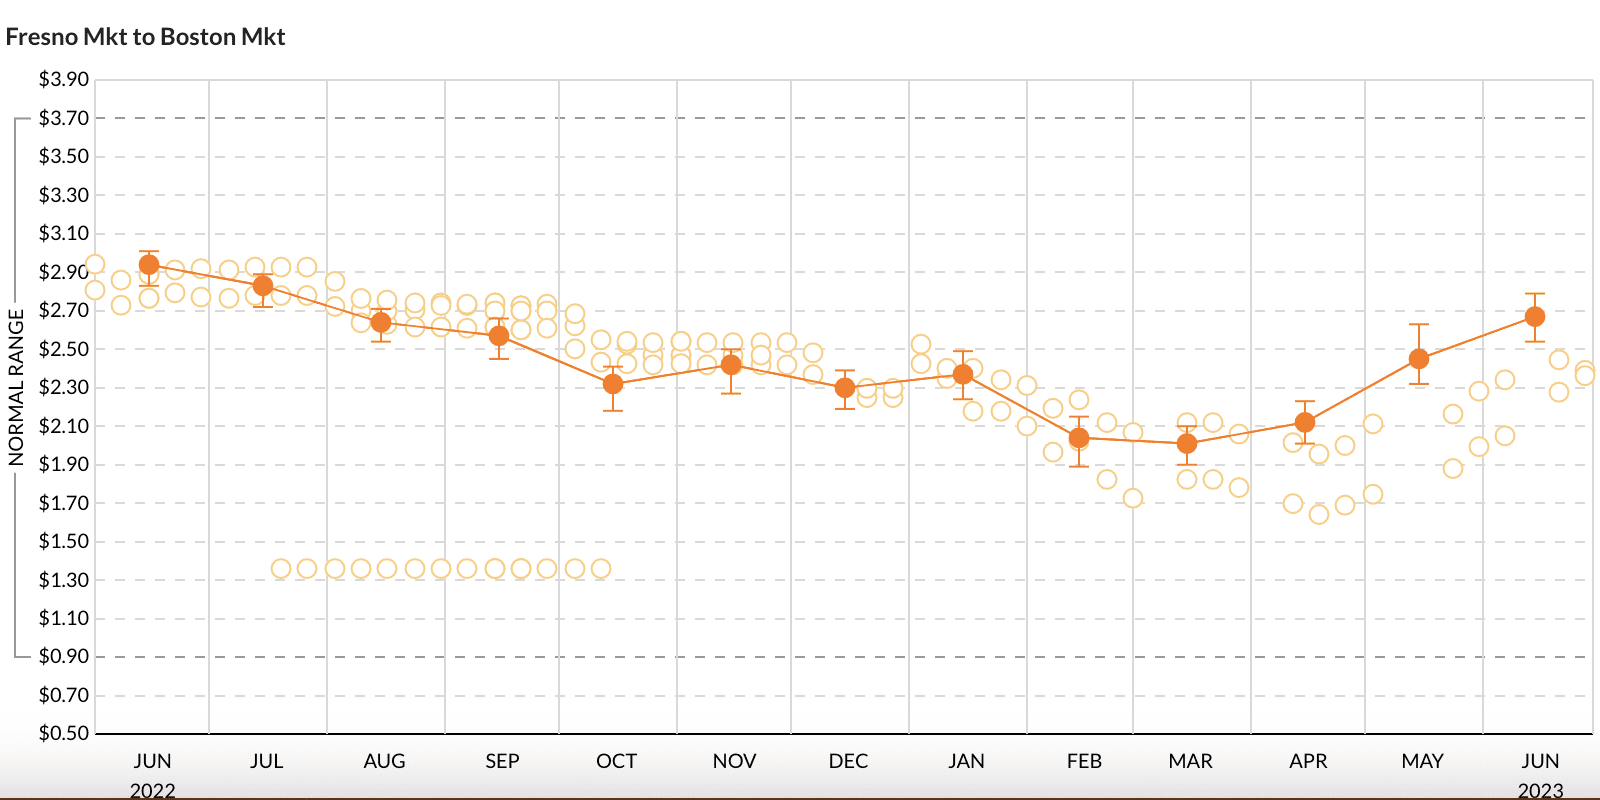
The last and most exciting part of using RateView happens when customers contribute their broker-to-carrier spot or contract purchases to DAT. Below is a capture of the Fresno-to-Boston lane (reefer). While this is test data, it shows how RateView can be used to highlight the effectiveness of your brokerage’s pricing decisions. The test company in question was paying above market last summer into the winter. Since March of 2023, pricing decisions have been better and the brokerage in our test data has been paying below average, often below the 25th percentile in pricing. There could be a lot of factors in play here including leveraging better carrier relationships, more effectively planning routes with backhauls, or other incentives for carriers.
Please reach out to your customer success team member if you have any questions, or if you would like more information about how DAT can help your brokerage use any of our tools.