Why are outbound van rates always so high in Memphis?
Usually, when rates remain elevated in a market or lane, there is an obvious imbalance between loads (demand) and trucks (capacity.) The imbalance might be caused by an increase in freight availability and/or a shortage of trucks. DAT offers a wealth of data and tools to help our customers detect and analyze such imbalances and forecast future rate trends with greater accuracy.
Memphis is a bit of a puzzle, though. Lane rates are consistently high, but the usual indicators are unremarkable. To understand the market dynamics in Memphis, we need to take a deeper dive into the data pool.
Following are four visualizations, based on data from DAT Solutions, to help explain Memphis rate trends:
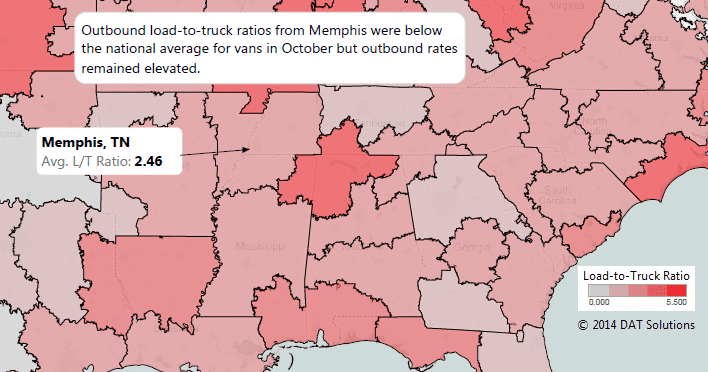
Load-to-truck ratios in the Memphis market are below the national average. On DAT Load Boards, we look to the load-to-truck ratio as a quick indicator of capacity pressure. It’s a simple calculation: take the number of load posts and divide by the number of truck posts, and look at the resulting ratio on a local, regional or national basis. But the load-to-truck ratio outbound from the Memphis market averaged under 2.5 in October, which was lower than the national average of 2.8 for that month.

Outbound load volume in Memphis is not extraordinarily high. September volume was in the tens of thousands, for example. Those are not huge numbers, especially when compared to larger regional hubs such as Atlanta. Since 2011, there has been a 41% increase in load posts with Memphis as the origin, but as with the load-to-truck ratio statistics noted above, the Memphis numbers are lower than the increases in load posts nationwide during the same period.

500-mile average length of haul creates vulnerability under HOS. In a lane-by-lane analysis of load availability on the highest-volume lanes originating in Memphis, I noticed some interesting patterns. First, seven of the top ten destinations are located within 500 miles of Memphis. That’s a single day of driving — or at least, it used to be, under the Hours of Service rules that were in effect prior to July 2013. The new HOS could push those trips beyond the one-day limit, increasing costs for the carrier. Also, the average length of haul is more than 800 miles for spot market truckload freight, and a shorter haul typically commands a higher rate per mile.

Imbalance of outbound vs. inbound demand. On the top ten high-volume lane pairs, the traffic is two to ten times as heavy outbound from Memphis, compared to inbound. The most extreme example is Oklahoma City; there is 901% more demand for vans headed from Memphis to OKC than from OKC to Memphis. Even though there are thousands of trucks per month looking for outbound freight from Memphis, hardly any of those truckers came from Oklahoma City.

Outbound lanes from Memphis are priced far above the national average, and those rates continue to rise. As noted before, the lanes with the highest demand and shortest length of haul tend to command the highest rates. Seasonal pressures drive rates even higher in April on the lane to Oklahoma City, and in June on the lane to Cleveland.
If you had access to this type of information about key markets in your network, would it lead you to change anything about your operation? Your pricing? Business development? Carrier selection?
DAT Professional Services provides customized data analytics and reporting capabilities that deliver actionable market intelligence for your company. To learn more, call our award-winning customer service team at 800.551.8847 or fill out this online form.
Jeff Nastoff is an Industry Market Specialist at DAT Solutions, where he helps transportation and logistics professionals to improve and act on their grasp of dynamic market conditions. Jeff previously worked for Merrill Lynch and Cost Advisors, Inc. He holds an MBA from University of Oregon.