Comparing Q2 spot market rates to contract rates, we found that the regions of highest demand shifted dramatically in May:
- As a national average, 23% to 24% of lanes had spot market rates that were higher than contract rates in each of the three months. There was almost no change nationwide, month over month.
- In May, the focus shifted from the Midwest to the Southeast.
- In April, nearly half of the lanes with higher spot market rates originated in the Midwest.
- In both May and June, half of the higher rates originated from Southeastern states.
- When spot market rates were higher than contract rates, the average difference was between $0.19 (April) and $0.24 (June.)
- When contract rates exceeded spot market rates, the difference was $0.30 to $0.33 in April and May, respectively, but only $0.22 in June. That’s because van rates rose in June across the board.

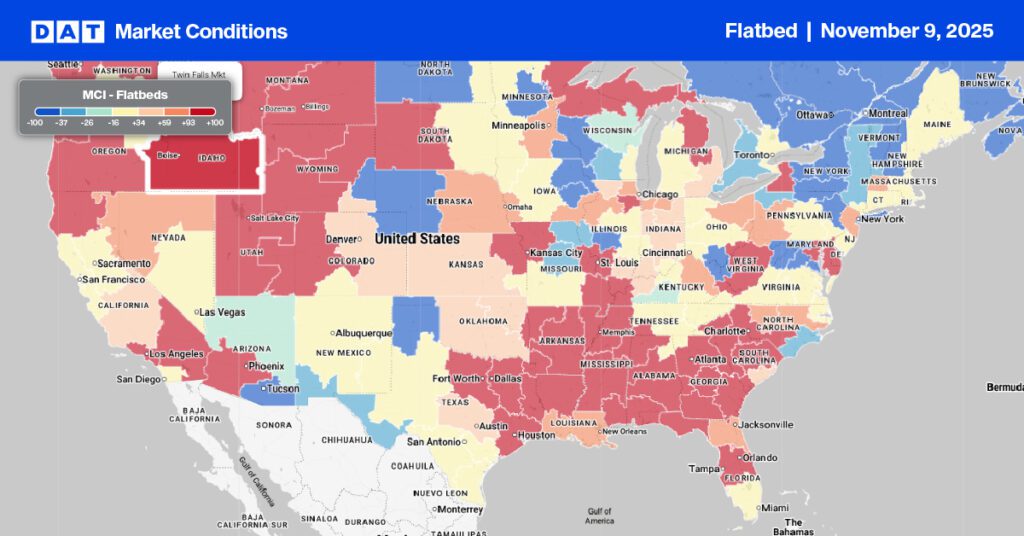
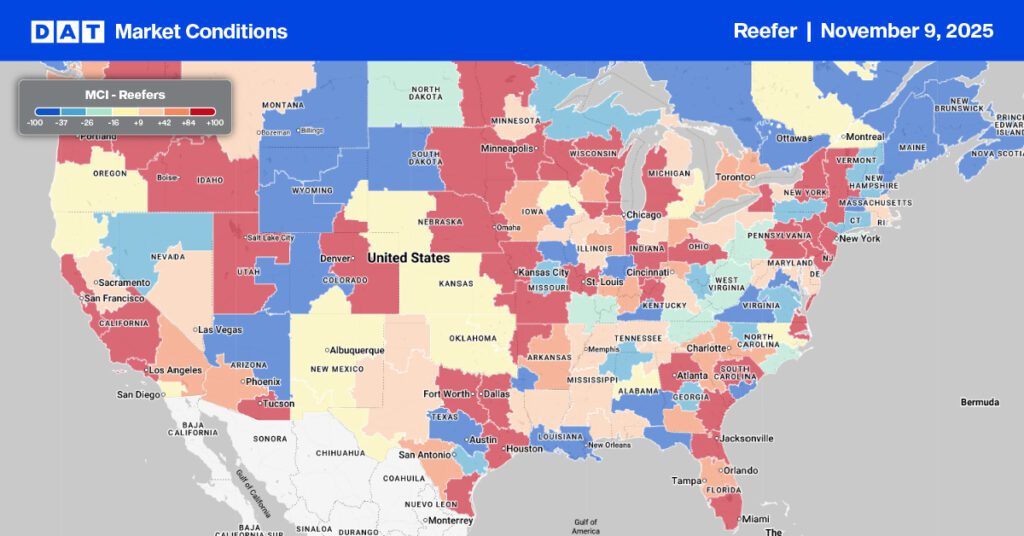
In April, ten Midwestern states were the source of the highest demand for dry vans on the spot market. The focus shifted in May to the Southeast and remained there through June. The high demand led to high rates, and spot market rates exceeded contract rates in almost half the lanes in each region during those months, as indicated by the darkest orange shade in the two maps above.
Why is this important? In peak seasons, brokers may be in a position to offer the carrier more than a shipper would pay in a direct contract rate. That’s because the broker’s spot market rates respond overnight to shifts in the demand and supply of trucking services. For vans, the primary trucking freight mode, average contract rates are typically higher than spot market rates. In certain markets or regions, however, seasonal demand will drive spot market rates up even when contract rates aren’t changing.
Carriers and brokers can improve their profitability when they able to shift at least a portion of their business to these “hot markets” during periods of high demand. The key – especially for non-asset based transportation companies – is to identify business opportunities with customers whose seasonal transportation needs dovetail with your existing business.
Asset-based carriers may need to re-position trucks and drivers for several months of the year, in order to exploit seasonal trends. Another option is to develop creative dispatch solutions – such as trihaul routes – to increase your access to those markets during periods of high rates.
Click to download the full report on Q2 spot market rates and contract rates. We will continue to publish analyses and comparisons of spot market rates and contract rates in future newsletters throughout the year, to track seasonal trends and identify areas of opportunity. These statistics don’t capture the full flavor of your real-world experience moving freight, however. If you can take a few moments, please click on the comment field below and tell us what you’re seeing in the marketplace. Thanks.