In July 2025, the Logistics Managers’ Index (LMI) registered a reading of 59.2, indicating continued—but moderating—expansion in the logistics sector. From a truckload carrier’s perspective, the standout trend is the growing divide between small and large firms, with smaller logistics companies driving much of the industry’s momentum (LMI: 62.1 vs. 56.2 for large firms). These smaller players, many operating in the “middle-mile” segment, are holding elevated inventories imported ahead of new tariffs, generating increased freight volumes for upstream and regional hauls. Transportation Utilization rose sharply to 59.5, particularly among upstream firms, suggesting that demand for long-haul and regional freight—especially from ports and distribution centers—is solid despite broader economic uncertainty.
Get the clearest, most accurate view of the truckload marketplace with data from DAT iQ.
Tune into DAT iQ Live, live on YouTube or LinkedIn, 10am ET every Tuesday.
However, significant cost pressures remain. Inventory and warehousing costs are still elevated, and diesel prices have climbed to $3.805 per gallon, squeezing margins for truckload carriers. Meanwhile, the full impact of new U.S. tariffs (now averaging 18.3%) has yet to play out across supply chains. Carriers should be aware of fluctuating demand patterns, as downstream retailers appear to be pulling back, creating potential soft spots in final-mile freight. On balance, truckload carriers positioned in or near import-heavy corridors—or aligned with upstream distributors—stand to benefit from the current environment, but caution is warranted as trade policy and fuel costs continue to inject volatility into the market.
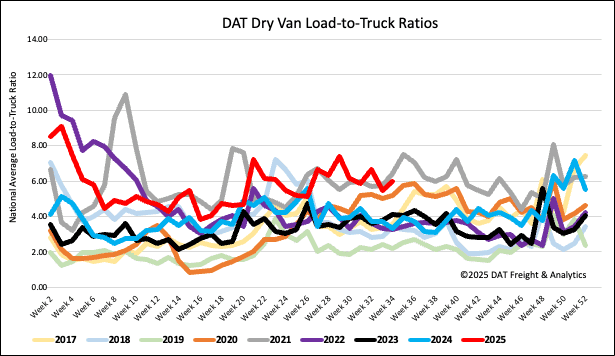
Load-to-Truck Ratio
Last week, dry van load posts remained largely unchanged, though capacity saw a slight tightening due to an 8% decrease in carrier equipment posts. Despite this, load post volumes are still 11% higher than last year and the long-term Week 33 average (excluding the pandemic-influenced years of 2020, 2021, and 2022). This resulted in the dry van load-to-truck ratio climbing 10% to end the week at 5.99.
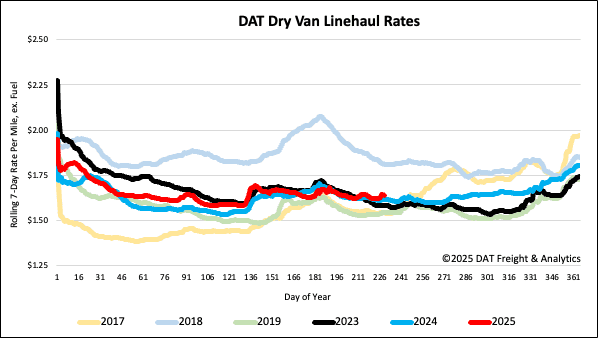
Linehaul spot rates
Dry van linehaul spot rates increased by a penny last week, averaging just under $1.65 per mile, remaining $0.02 higher than the same time last year and $0.06 higher than in 2023.
The average rate for DAT’s top 50 lanes by load volume remained unchanged at $1.99 per mile for the third week and $0.34 higher than the national 7-day rolling average spot rate.
In the 13 key Midwest states, which represent 46% of national load volume and often indicate future national trends, spot rates were down a penny on a 3% higher volume of loads moved. Carriers in these states earned an average of $1.86 per mile for the second week, which is $0.21 above the national 7-day rolling average.