All rates cited below exclude fuel surcharges, and load volume refers to loads moved unless otherwise noted. The rate charts exclude 2021 and 2022 years influenced by the pandemic. Data analysis for the week ending Saturday, May 2nd, 2026.
Next week’s CVSA International Roadcheck, scheduled for May 12–14, 2026, is set to create a significant ripple effect across the trucking industry. This year’s 72-hour enforcement blitz arrives at a critical juncture as spot rates begin to recover and available capacity continues to tighten. With a specific focus on ELD compliance and cargo securement, the “added bite” of recent device revocations means that non-compliant carriers face immediate out-of-service orders, further squeezing an already lean market.
Get the clearest, most accurate view of the truckload marketplace with data from DAT iQ.
Tune into DAT iQ Live, live on YouTube or LinkedIn, 10am ET every Tuesday.
The real story behind the inevitable rate spikes isn’t just the inspections themselves, but the “voluntary parking” of thousands of drivers. Data from previous years shows a double-digit decline in equipment posts on DAT One during Roadcheck week, as small carriers and owner-operators choose to sit out rather than risk downtime. While officials conducted over 56,000 inspections during the 2025 event, the broader market impact comes from the thousands of other drivers who opt to stay off the road entirely, creating a measurable supply shock.
Reefer and flatbed markets are expected to see the most dramatic tightening. Reefer carriers typically take time off at twice the rate of other segments, and this year’s overlap with Mother’s Day weekend will further compress the capacity available for perishable freight. Meanwhile, flatbed operators will face intense scrutiny regarding load securement. For shippers and brokers, these three days represent a predictable but potent calendar-driven friction that will likely trigger sharp rate spikes heading into mid-May.
National dry van linehaul spot rates
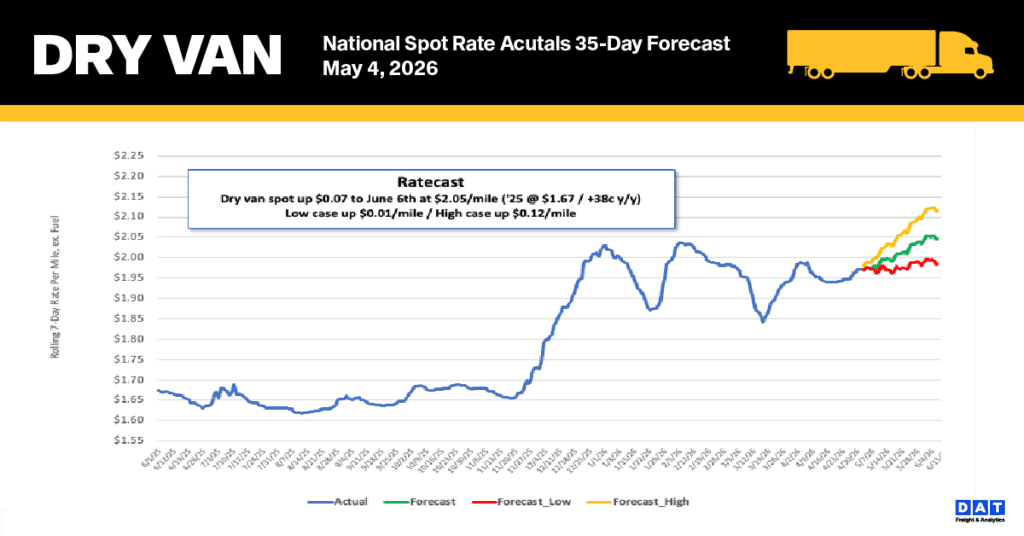
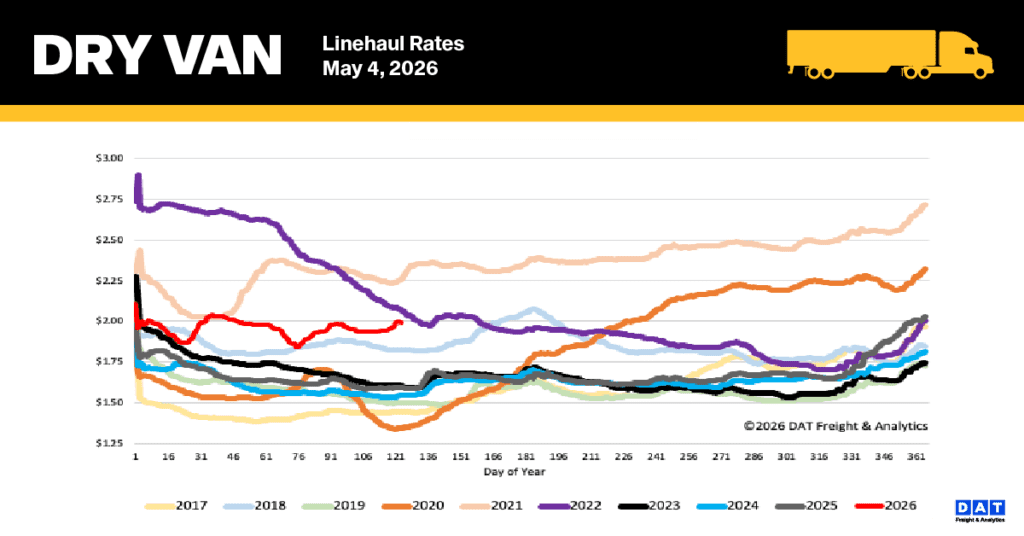
The national 7-day average linehaul spot rate for dry vans (excluding fuel) climbed by a cent over the last week to reach $2.00 per mile. This current rate significantly outpaces historical benchmarks, standing $0.40 (25%) above the figures from one year ago. Additionally, when excluding years impacted by the pandemic, the rate is $0.47 (23%) higher than the five-year average.
Last week, spot rates on DAT’s top 50 lanes, based on load volume, increased a penny per mile, settling the average at $2.36 per mile. This figure is $0.36 higher than the national 7-day rolling spot rate.
Responsible for nearly 50% of the nation’s load volume, the 13-state Midwest region serves as a vital economic indicator. Average linehaul rates here rose $0.01 per mile to reach $2.29 per mile. While the gain was slight, the Midwest remains a strong performer, maintaining a $0.29 lead over the national 7-day rolling average—a strength reflected across its primary shipping lanes.
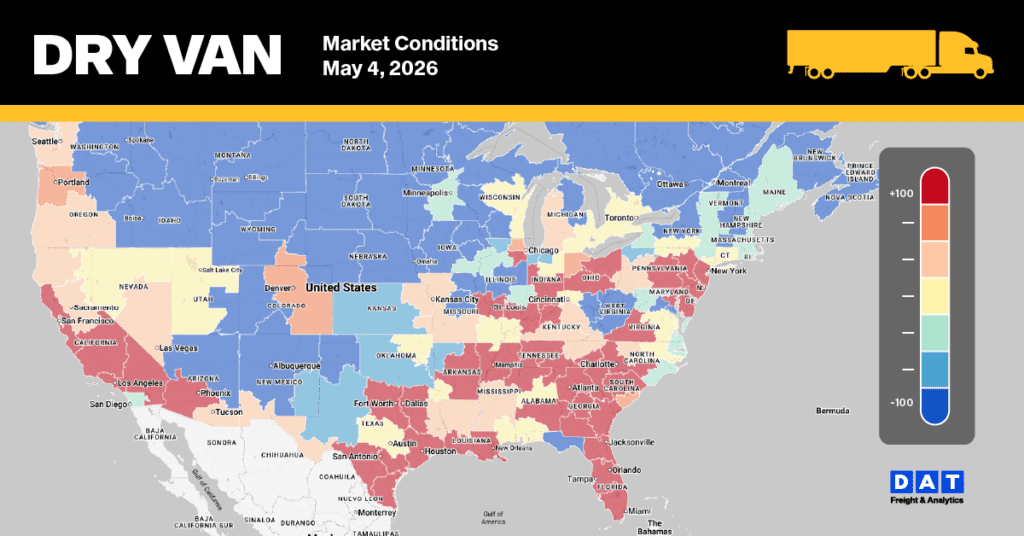
Dry Van Market Conditions
Driven by a 6% weekly rise in load post volumes and the characteristic end-of-month shipping spike, the national dry van load-to-truck ratio jumped 21% to 8.68. Regulatory and enforcement pressures continue to push capacity out of the market, leading to the lowest equipment post count of the year. This metric fell 12% last week and is 23% below last year’s levels. Furthermore, current equipment availability is 44% lower than the long-term average since 2017, when excluding pandemic-related data from 2012 and 2022.