U.S. manufacturing expanded in April for the fourth consecutive month, with the ISM Manufacturing PMI holding steady at 52.7% — matching March’s reading exactly. New orders continued to gain ground, rising to 54.1% from 53.5%, signaling that demand hasn’t buckled yet under the weight of geopolitical uncertainty. Production also remained in expansion at 53.4%, though it pulled back 1.7 points from March. The headline number looks solid, but the details tell a more complicated story.
Get the clearest, most accurate view of the truckload marketplace with data from DAT iQ.
Tune into DAT iQ Live, live on YouTube or LinkedIn, 10am ET every Tuesday.
The two data points that should command attention are prices and employment. The Prices Paid index surged to 84.6% in April — a 6.3-point jump from March and the highest reading since April 2022, at the peak of the post-pandemic inflationary cycle. Input costs are rising fast, driven largely by energy prices tied to the Iran conflict and ongoing tariff exposure. Meanwhile, the Employment Index fell to 46.4%, down 2.3 points, with 60% of panelists reporting they’re managing headcounts rather than hiring. That combination — expanding orders alongside shrinking payrolls and spiking input costs — puts the Fed in a difficult spot, with inflation signals and labor signals pointing in opposite directions.
What manufacturers are actually saying reinforces the data. Companies across sectors — Transportation Equipment, Chemical Products, Machinery — cite rising fuel and energy costs, tariff pressure, and Red Sea and Strait of Hormuz disruptions as immediate concerns. One Chemical Products respondent noted that all products tied to crude or energy have seen multiple cost spikes tied to the Iran crisis. A Machinery executive put it plainly: “We haven’t started to see the full impact of fuel increases but are aware they are coming.” That’s the phrase that matters for freight. The cost shock is in motion, it hasn’t fully landed yet, and supply chains will feel it over the coming months.
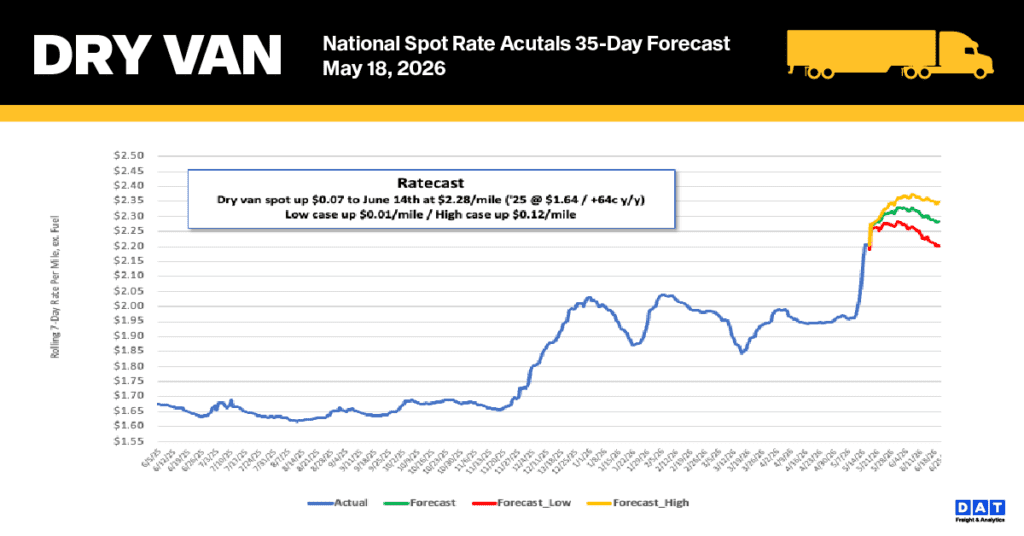
National dry van spot rate trends
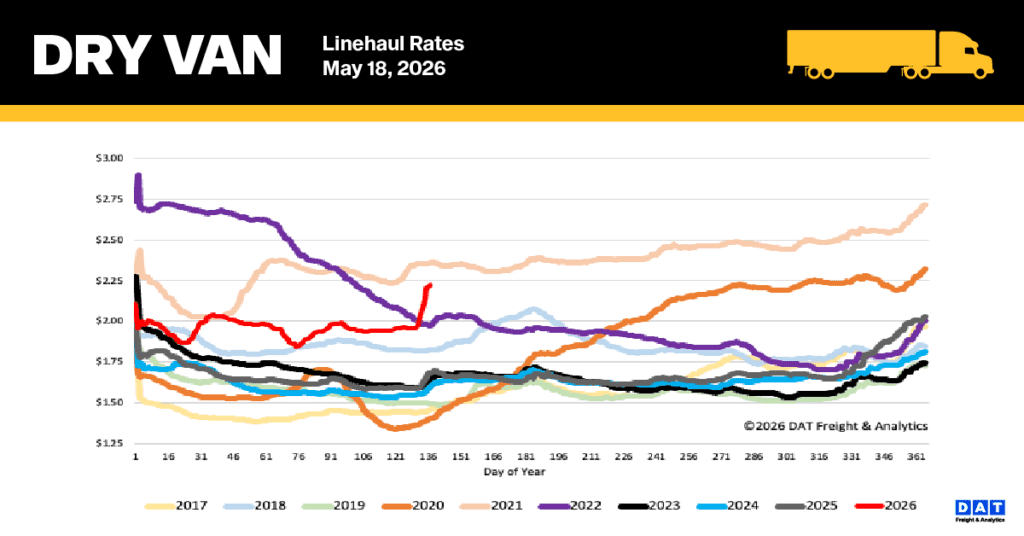
Driven by the Roadcheck Week capacity crunch, dry van linehaul rates surged by a record $0.21 per mile last week. The national 7-day average linehaul spot rate (excluding fuel) reached $2.22 per mile, significantly outperforming historical benchmarks. This current rate is $0.54 (32%) higher than the same week last year and sits $0.66 (30%) above the non-pandemic five-year average.
Key market segments showed the following performance:
- High-Volume Lanes: Average rates on DAT’s top 50 lanes jumped by $0.15 per mile to $2.51, maintaining a $0.29 premium over the national 7-day average.
- Midwest Region: Serving as a vital economic indicator with nearly half the nation’s load volume, the 13-state Midwest region jumped by $0.16 per mile, averaging $2.44 per mile, continuing its trend of consistent outperformance across major corridors.
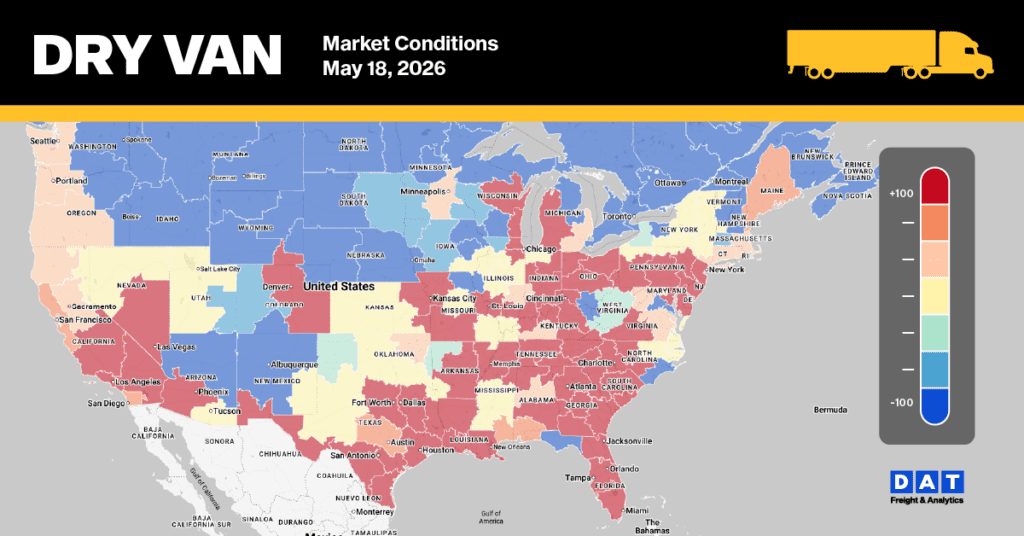
Dry Van Market Conditions
During the annual 72-hour CVSA carrier safety blitz, the national dry van load-to-truck ratio jumped 54% to 13.38 as capacity tightened significantly. While load post volumes increased by 36%, the number of carriers searching for loads on our board dropped 11% week-over-week, 4 points higher than the 9-year average for Roadcheck Week and 21% below last year’s levels. When excluding pandemic years (2012 and 2022), current equipment availability is down 45% compared to the long-term average tracked since 2017.