As the headlines continue to call out potential recession fears, the Logistics Managers’ Index came in at 60.7 in July, down from June’s reading of 65.0. This is the lowest reading since May of 2020 and the second consecutive reading below the all-time index average of 65. This month’s reading still represents a healthy rate of expansion, however, the transportation metrics are the driving force behind the downward shift.
The Transportation Prices Index came in at 49.5 in July and with a reading under 50.0, showing a state of contraction for the first time since May of 2020. The survey also highlighted the increased capacity with growth in the available Transportation Capacity Index coming in at 69.1 which jumped 7.4 points from the previous month and reached a new 3-year high. The Transportation Utilization Index was up (+0.9) slightly to 59.3, marking 27 consecutive months of growth for this metric. During the second quarter, truck shipments were actually up 2.3% from the first quarter and many larger fleets are predicting favorable conditions through the second half of 2022.
A hot topic has been the increases in retail inventory levels, the report’s Inventory Level value is 68.8, down (-3.0) from June’s reading of 71.8, and down significantly (-11.4) from the index’s all-time highest value recorded this March. The LMI report highlights signs of a slowdown in what had been out-of-control inventory growth as the current value is a mere 2.4 points higher than the same time last year. Seasonally speaking, inventories are increasing only slightly more quickly than one year ago.
On the topic of inventory, Zac Rogers, an assistant professor of operations and supply chain management at Colorado State University and co-author of the LMI said, “We have seen inventories climb at an unprecedented rate over the last six months. What that really has to do with is the fact that supply chains are so long-tailed—longer tailed now than they really should be because of things like shutdowns at Shanghai, congestion at ports, and overcrowded warehouses. Everything is moving more slowly. What I keep hearing from folks is that whatever your normal lead times are, you can expect them to essentially triple—so that what would typically take 90 days to produce now takes 270 days. These are really long lead times, and the inventories that we see now reflect an economy that no longer exists. They reflect the economy of 2021, when we had really hot consumer spending.”
All rates cited below exclude fuel surcharges unless otherwise noted.
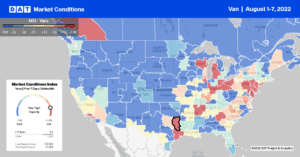
In the six major intermodal freight markets (Los Angeles/Ontario, Dallas, Kansas City, Joliet, and Chicago) impacted by congestion and capacity issues, truckload spot rates increased by $0.03/mile last week. On the intermodal-heavy lane from Los Angeles to Chicago, dry van rates increased to $1.82/mile or $0.11/mile higher than the July average. Further inland in the Joliet market, where the CenterPoint Intermodal Center (CIC) is located, the largest inland port in North America, spot rates increased by $0.07/mile to an average outbound rate of $2.31/mile. Load post volumes were up 6% w/w resulting in the reversal of rates trends in July, which had declined for the prior three weeks.
Loads from Joliet to Worcester, MA, where another central intermodal hub is located, were paying $0.35/mile higher last week at $2.86/mile. Truckload capacity was very tight on the Joliet to Dallas lane, where spot rates increased by $0.53/mile over the July average to $2.32/mile last week. Spot rates on the Joliet to Elizabeth lane were also up by almost $0.20/mile to $2.53/mile last week. Loads from Elizabeth back to Chicago were flat last week at $1.51/mile, while loads south to Atlanta were up slightly to an average of $1.62/mile. Flash flooding and road closures along the Mississippi River in the last few weeks resulted in capacity being in short supply in the Quincy, IL, market. Dry van rates jumped $0.18/mile last week to $2.35/mile after declining for the three weeks prior – load post volumes also increased by 20% w/w.
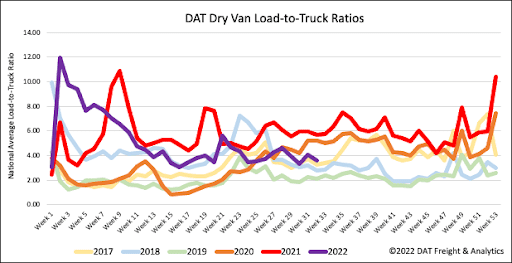
Load post volumes fell predictably during the first shipping week of the month – down 8% w/w and almost 33% lower than last year. Carrier equipment posts increased 4% w/w and are now just 3% higher than 2019, which was not a very good year for truckload carriers as the market became over-supplied. As a result of lower load posts and higher equipment posts last week, the dry van load-to-truck (LTR) decreased by 11% to 3.59, or almost the same as 2017 LTR levels.
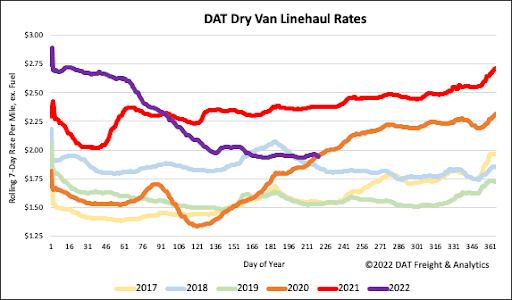
National average linehaul rates excluding fuel are holding their own after remaining flat last week at just under $1.97/mile. Compared to DATs Top 50 lanes, which averaged $2.36/mile last week, the national average was $0.36/mile lower last week. Dry van linehaul rates are also $0.44/mile lower than the previous year, $0.10/mile higher than in 2018, and still $0.35/mile higher than the average of pre-pandemic years.


