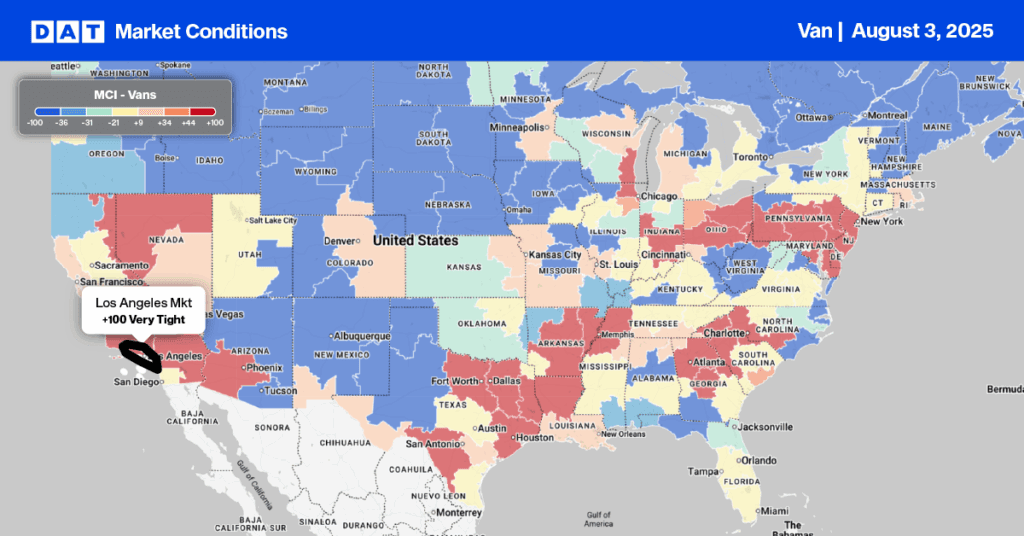
In June 2025, the Port of Los Angeles experienced its highest-ever June shipping container traffic, processing 892,340 twenty-foot equivalent units (TEUs). This record surge was primarily driven by importers expediting shipments in anticipation of upcoming tariff increases, particularly on goods from China. While overall imports from China, which constitute roughly 50% of Los Angeles’s imports, increased by 4% in June, they saw a significant 22% year-over-year decline due to this “frontloading” effect.Get the clearest, most accurate view of the truckload marketplace with data from DAT iQ.
Tune into DAT iQ Live, live on YouTube or LinkedIn, 10am ET every Tuesday.
Looking ahead, the National Retail Federation (NRF) offers a cautious outlook for the rest of 2025. They anticipate further decreases in import volumes, a consequence of elevated imports in late 2024 and the ongoing tariff uncertainties. Global Port Tracker forecasts July to reach 2.36 million TEUs, marking a 2.1% year-over-year increase. However, August is projected to see a 10.4% year-over-year decrease to 2.08 million TEUs, and September is expected to drop even further to 1.82 million TEUs, a 19.9% decrease and the lowest total since December 2023.
Despite the strong import figures in June, industry experts note a prevalent sentiment of caution and a more strategic approach among companies moving forward, largely attributed to the uncertain tariff environment.
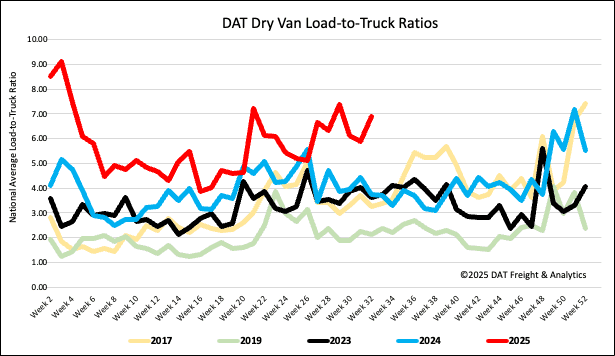
Load-to-Truck Ratio
Last week saw an increase in load post volumes by 4% and 8% year-over-year at month-end. This coincided with a 10% decrease in carrier equipment posts, indicating a slight tightening of capacity. As a result, the dry van load-to-truck ratio rose to 6.89.
Note: To provide a clearer view of seasonal trends, the pandemic-influenced years of 2020, 2021, and 2022 have been excluded.
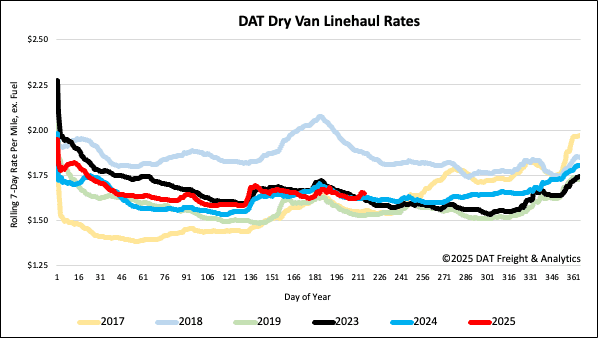
Linehaul spot rates
Dry van linehaul spot rates were mostly flat for the second week, averaging just over $1.65 per mile, around $0.02 higher than the same time last year and 2023.
The average rate for DAT’s top 50 lanes by load volume decreased $0.01 per mile to $1.99 per mile and $0.34 higher than the national 7-day rolling average spot rate.
In the 13 key Midwest states, which represent 46% of national load volume and often indicate future national trends, spot rates were flat on a slightly higher volume of loads moved. Carriers in these states earned an average of $1.86 per mile for the second week, which is $0.21 above the national 7-day rolling average.