Revenue rose steadily throughout 2017 for freight brokers in the DAT Keypoint benchmark project. The benchmark report draws data from an aggregate of DAT customers whose average annual revenue of $19.5 million grew 26% compared to 2016.
The revenue increase was fueled by 16% increases in both the number of loads and the total revenue per load. Rates rose rapidly during the year, contributing to the revenue increase. However, gross margins for the group dropped to an average of 13.7% from 14.8% in 2016, as costs increased faster than billings.
Total profit for the year also declined 11% compared to 2016, due largely to a few challenging months when expenses rose faster than revenues. Also, brokers tended to postpone profits from December to January, to take advantage of this year’s more favorable tax laws. That made December seem less profitable for the group, which had a big impact on quarterly results.
A Challenging but Successful Year, in Graphs
The selection of graphs below tell the story of a challenging but successful year. Brokers moved more loads in 2017, with higher revenue per load and higher revenue per employee. Costs rose faster than revenues, however, reducing profitability in some months and paring down gross margins for the year. The cost increase was associated primarily with rising spot market rates. Labor costs also grew throughout 2017.
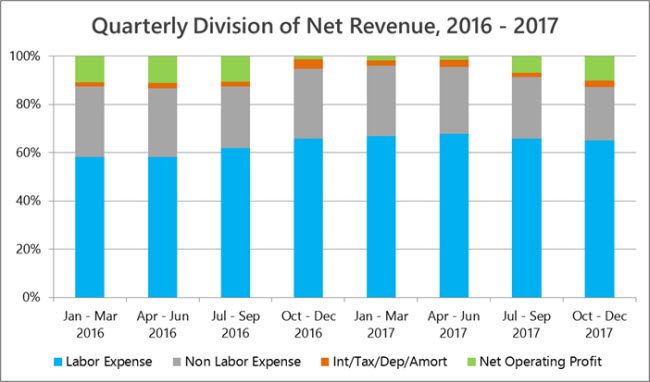
Labor costs rose to 66% of net revenue in Q4 2016 and stayed in the 65% to 67% range for all of 2017. During the same period, non-labor expense declined from 29% to 22% as a portion of net revenue. The combination of the two put a squeeze on net operating profits, beginning in the fourth quarter of 2016, until profitability rebounded for the group in the second half of 2017.
 Costs began to climb in Q4 2016, with labor expense leading non-labor expense, as brokerage companies in the group prepared to handle the revenue growth to come.
 Revenue per employee held steady from Q4 2016 through Q2 2017, but average profit declined on a per-employee basis. The brokerages increased headcount during that period, to position their companies for additional growth.
 Load counts increased 16% in 2017, including a 22% increase in the fourth quarter, compared to 2016. Steady, quarter-over-quarter growth in load counts began in Q1 2016 and accelerated in Q2 2017.
 Revenue per load increased steadily in 2017, on both a year-over-year and a quarter-over-quarter basis, rising from an average of $1,226 per load in Q1 to $1,549 in Q4. Profits lagged during the period from Q4 2016 through Q2 2017, however, due to increased costs. From a $4.63 profit per load in Q1, the group’s average results improved to $22.42 per load in Q4. Profitability would likely have been higher in Q4, but many brokers moved profits to the new tax year.
 Rapid increases in spot market freight rates led to margin compression for many freight brokers in 2017. Gross margins fell to 11% in January, due to extreme weather, then declined again to 13% from May through June, as rates began to rise sharply.
The DAT Broker Benchmark project analyzes revenues, expenses and profits, based on more than 25 key performance indicators available in DAT Keypoint, the transportation management system developed exclusively for freight brokers. Need a TMS? Request a demo.