Mexico’s produce season drives significant truckload volumes in North America during the first half of each year, accounting for over a third of the continent’s total produce volume. Despite this, tariff uncertainties have led to considerable volatility, resulting in a 5% year-to-date (YTD) decrease in volumes compared to last year.
Get the clearest, most accurate view of the truckload marketplace with data from DAT iQ.
Tune into DAT iQ Live, live on YouTube or LinkedIn, 10am ET every Tuesday.
Over 90% of Mexico’s fresh fruit and vegetable exports are destined for the United States, making it the primary recipient. The top five exported produce items—tomatoes, watermelons, avocados, peppers, and cucumbers—account for 46% of year-to-date volumes. A significant portion of these imports, over half, enter the U.S. via Texas, with the Pharr commercial zone in Texas handling nearly 75% of the total truckload volume.
In 2023, Mexico supplied an estimated 25.1 billion pounds of fresh produce to the U.S., valued at about $18 billion. That’s the equivalent of almost 600,000 truckloads annually. Mexican avocado exports alone to the U.S. were valued at over $3.5 billion in recent years, with the U.S. market accounting for over 80% of Mexico’s total avocado exports.
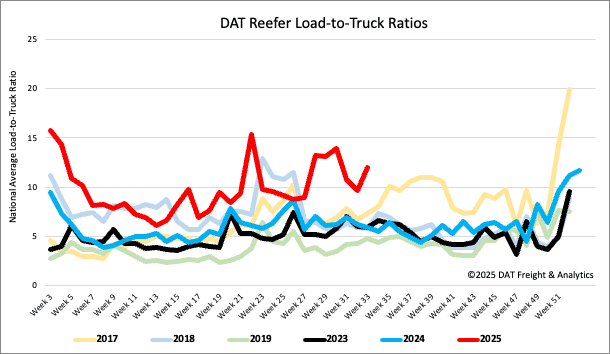
Load-to-Truck Ratio
Last week, the reefer load-to-truck ratio rose to 11.95. This was due to a 12% increase in reefer load post volumes at month-end, while equipment posts decreased by 10% week-over-week.
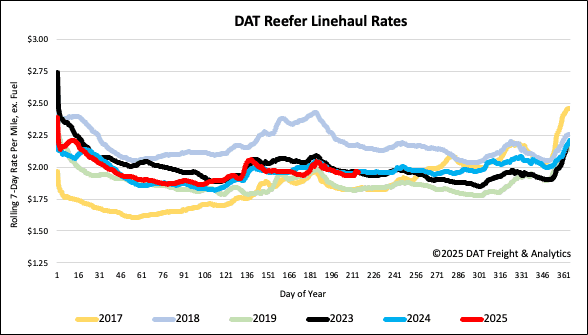
Note: To provide a clearer view of seasonal trends, the pandemic-influenced years of 2020, 2021, and 2022 have been excluded.
Spot rates
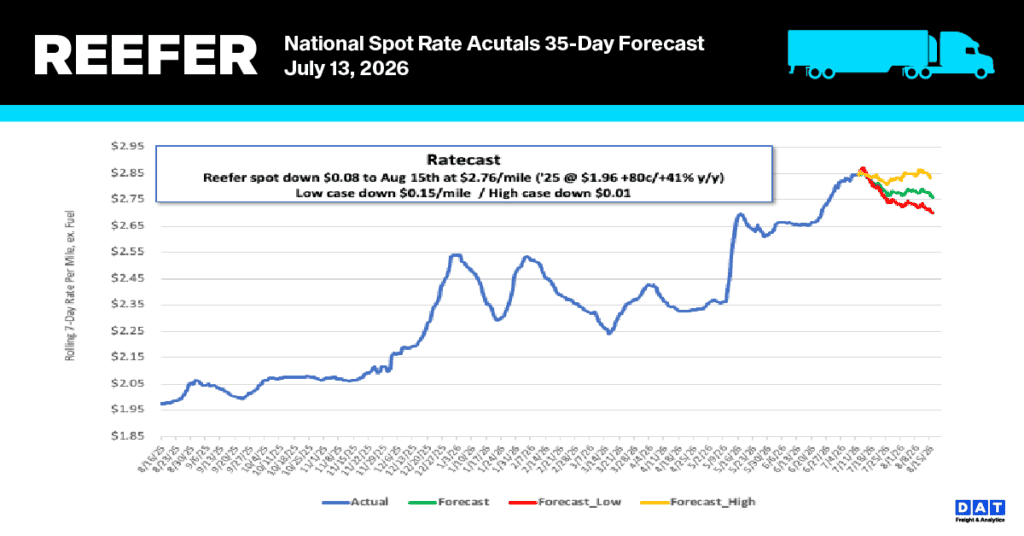
National reefer rates were flat for the second week, averaging $1.96 per mile. This rate is identical to the last two years.
Note: To provide a clearer view of seasonal trends, the pandemic-influenced years of 2020, 2021, and 2022 have been excluded.