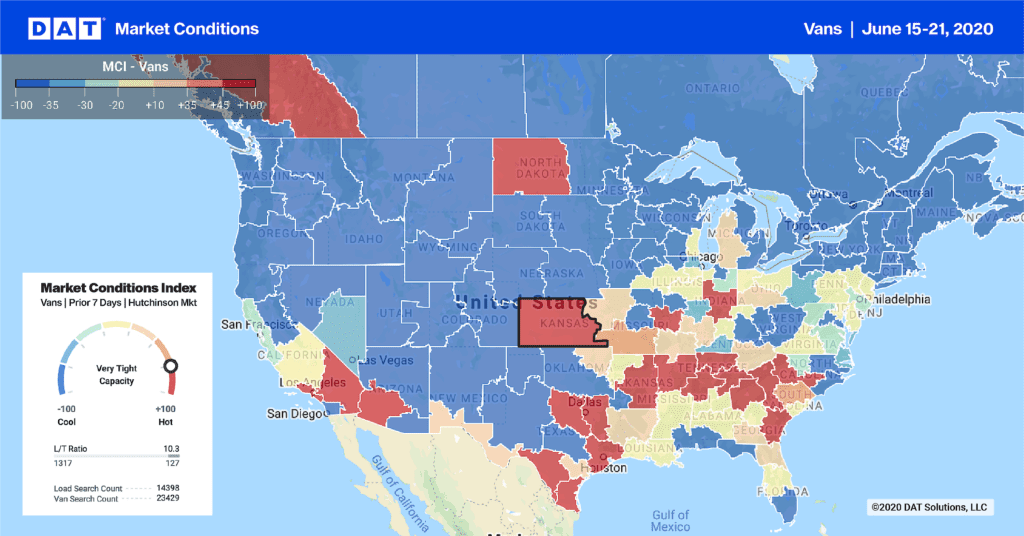
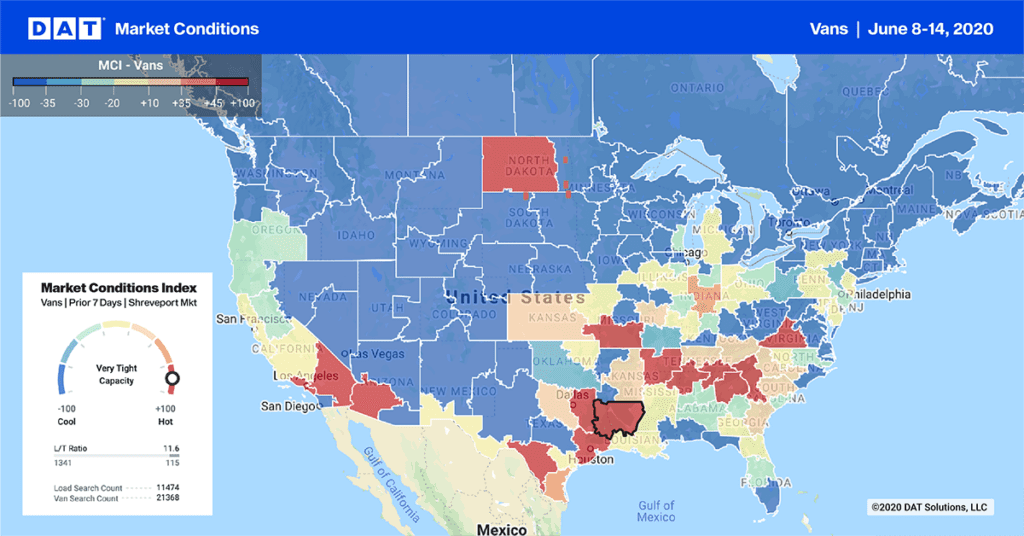
Spot market freight volume is booming again in mid-May. There is definitely a seasonal element to this abundance, but it seems clear that there was also real, measurable growth happening under those layers of snow and ice in the first quarter of this year.
Spot market freight trends went absolutely crazy in Q1, due to the extreme winter weather that disrupted supply chains nationwide. All those re-scheduled freight moves sent spot market volume soaring, but overall trucking freight tonnage was barely even with 2013 levels, and economic growth was nil.
While freight transportation has long been considered an early economic indicator, the spot freight market is an even earlier indicator of economic growth, stagnation or decline. That model went sideways in Q1 — probably skidding on black ice — but it’s back on track now, and all indicators are pointing to growth.
April Thaw Brings Freight Surge – In April, backlogs had mostly cleared the pipeline and truckload freight levels began returning to seasonal norms, but things didn’t stay “normal” for long. From mid-April through the month of May, an abundance of freight was again flowing, but this time, to both the contract carriers and spot market players are enjoying the new business. On the spot market, in particular, rates are way up for refrigerated (“reefer”) and dry vans, well above 2013 peak rates for both segments, while flatbed rates are hitting their stride in a more typical seasonal pattern.
Van Freight is an Economic Indicator – The sharp upturn in van rates is of special interest to economists as well as transportation and logistics professionals. Vans haul about 70% of truck freight, and much of that freight is comprised of consumer goods. Van freight trends can be the very first indicator of economic growth, including wholesale and retail volume.
Spot market rates have their own significance. Although as much as 80% of truck freight moves under contract and at a predetermined rate, a growing proportion of “exception” freight flows to the spot market when demand is rising, capacity is constrained, or there is a major shift in geographic distribution or supply chain design.
Spot Market Rates Respond to Demand, Capacity Levels – Typically, spot market rates are about 10% to 15% below contract rates. Spot market rates are paid to carriers by freight brokers and 3PLs, and payment to those intermediaries is folded into the rate they receive from the shipper. The intermediaries negotiate and pay carriers on a one-off basis, and typically they pay what the market demands in a given lane on that day. When demand is high and/or capacity is tight, carriers gain leverage in those negotiations, and the market rate tends to rise.
Brokers Pay More Than Shippers, for 45% of Hauls – From mid-April through mid-May, the prevailing spot market rates were higher than shipper-to-carrier contract rates in 45% of freight movements in high-volume lanes. In previous years, the corresponding percentage was between 15% and 25%, so this year’s statistic reflects an extraordinary change in the marketplace.
.png)
Economists Didn’t Predict This Recovery – It seems that the economists and pundits are surprised by the strength of the economy in April. They might have been fooled by the weather in Q1 and its aftermath. Now it seems apparent that there was a quiet ramp-up of inventories and industrial activity happening behind the scenes. This became evident in April, but it didn’t show up in our spot market indicators until now, because the growth was masked by the return to more normal patterns following the weather-induced insanity of Q1.
All Indicators are Positive for April – The reports from April are emerging now, from other sources: the ISM is up 9.8%, ATA truck freight tonnage (not seasonally adjusted)rose 4.4%, and other economic indicators are turning positive despite gloomy Q1 results and forecasts.
Truckload Capacity Can’t Keep Pace With Demand – Capacity, however, remains limited by a number of well-known factors: regulations curtail truck productivity, fleet costs are rising faster than revenues, and experienced drivers are in short supply. Further, rail intermodal cannot accept additional volume on a moment’s notice, so there is not much opportunity to release the build-up of pressure on truckload capacity. I’ve heard and read that large carriers got bigger increases on their contract rates in the most recent procurement cycle, but many are uneasy about committing all their assets in long-term agreements whose rates may not remain profitable for the entire term of the contract.
Spot Market Offers Insights into Emerging Trends – Rapid changes in the freight environment can be a source of anxiety for transportation and logistics professionals. Uncertainty also presents opportunity, however. If you are able to monitor spot market conditions, the dynamic changes in spot market rates and capacity offer insights into emerging trends in contract freight. Transportation buyers need to know about spot market trends so they can manage trade-offs between inventory carrying costs and the just-in-time inventory management that leads to last-minute freight moves at spot market rates.
Here’s the pitch: If you need to move freight in North America, you really need DAT RateView. After 30 years in freight transportation and logistics, I am proud to have been involved in the creation of the database and tools that comprise DAT RateView. If it had been invented years ago, I would have used RateView daily — and I know I would have tried my best to prevent my competitors from ever hearing about it.


