Several key factors cloud the current freight outlook: The possible end of the extended unemployment insurance program next week, COVID-19 outbreaks in many states, uncertainty in consumer demand and rising retail warehouse inventories. The latter is one to watch if the economic recovery slows.
Several recent data points suggest inventories are rising faster than sales. The latest Logistics Managers Index showed June inventory levels jumped up by 7.6% month over month after being relatively flat during March, April and May. Warehouse capacity has been contracting for four months in a row, with the largest decrease in June dropping by a further 6% to its lowest level since the index began in early 2018.
The latest manufacturing and sales inventory report published last week by the Census Bureau showed that the inventory-to-sales ratio improved slightly to 1.51 in May from 1.67 in April. To put this into perspective, the current reading is higher than the peak in both the Great Recession and last freight recession in 2016, when the inventory-to-sales ratio recorded 1.48 and 1.43 respectively.
From a freight recovery perspective, high inventory-to-sales ratios eventually translates to lower truckload volumes. Rising inventory levels need a market, and soon, especially if the trend continues where shippers are using slower-moving intermodal containers to supplement stretched warehouse capacity.
Compounding the bearish freight outlook was last week’s CASS June report, which reported a 17.8% year-over-year decrease in freight shipments, although the latest result was an improvement on April – up 3.5% month over month.
The big question for businesses operating on the spot market is whether the recent run of increasing rates can be sustained given that overall freight volumes remain depressed year-over-year. Some specific freight commodities (groceries, household goods, building materials and electronics) have seen volumes increase during the pandemic, but supply chains are still struggling to readjust to meet inconsistent consumer demand. That continues to create network imbalances for large carriers, resulting in some shippers looking for short-term capacity on the spot market.
Dry van trends
Market Condition Index (MCI)
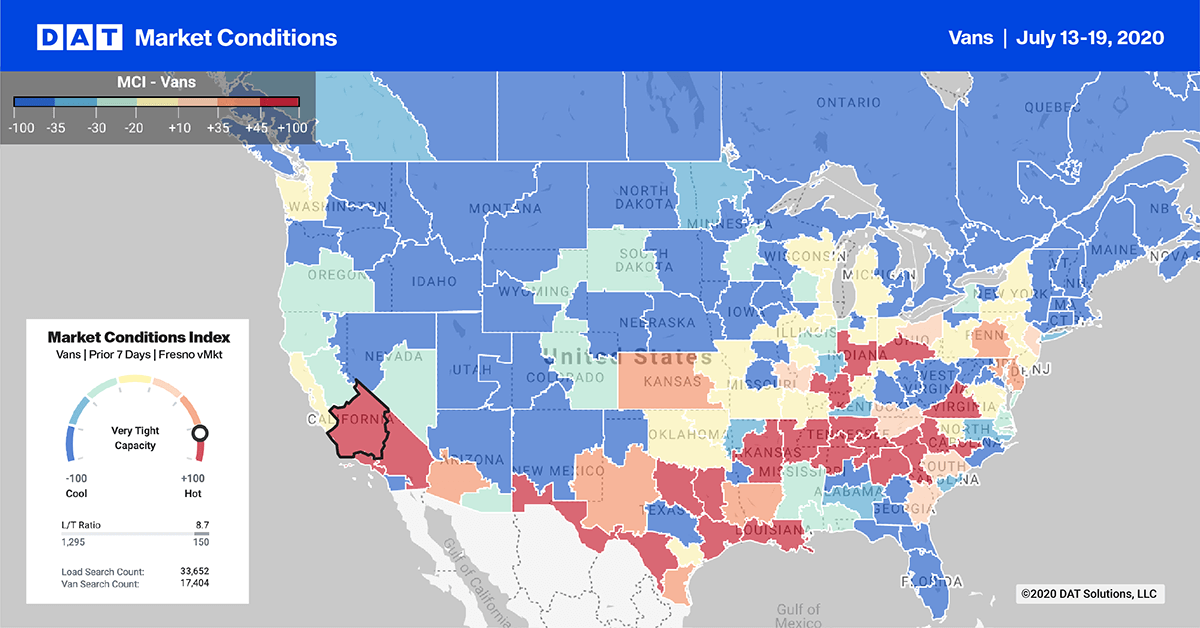
In the past two weeks, we’ve seen increased activity on the southern border in major freight markets. Geotab’s truck telematics data, which captures daily truck crossings in both directions, recorded a large increase in northbound truck crossings last week, up 15% as of July 17 when compared to the pre-COVID19 baseline in February 2020. In contrast, southbound truck crossings are still down 1%, creating an imbalance in freight for regional carriers.
The recent nationwide agricultural strike by Mexican workers also caused significant disruption to freight flows and tightened capacity along the border. The Laredo market, which accounts for close to half of all truck crossings from Mexico into the U.S., reported a 5% w/w increase in load posts, with the top destinations being Atlanta, Dallas, Joliet, IL; Greenville, SC; and Houston. Rates out of this market remain strong and are now up close to 7% since the start of July – a similar rate trend is also occurring in the McAllen and El Paso markets.
> Learn more about the Market Conditions Index
Load-to-truck ratio
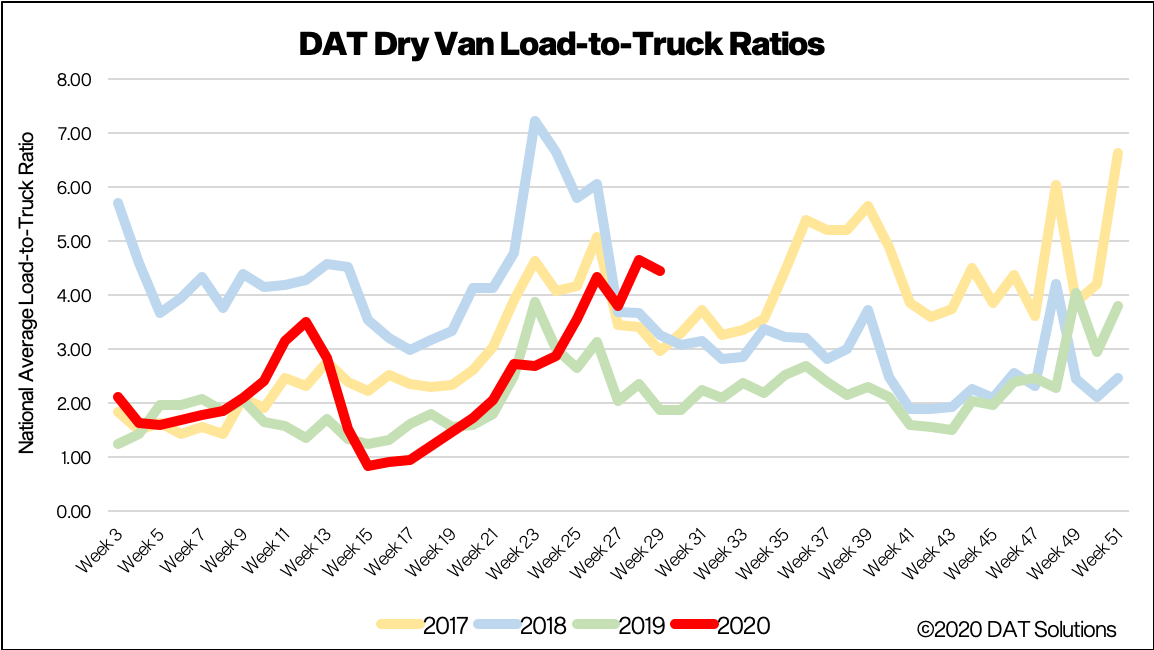
Last week’s load-to-truck ratio (LTR) dropped by 5% w/w to 4.44 as a result of 3% fewer loads posted and 2% more trucks posted The number of loads being posted is still exceptionally high for this time of the year.
To better understand capacity fluctuations, Geotab’s number of daily commercial truck trips in the U.S. dropped another percent last week and are now down 11% compared to the February 2020 pre-COVID19 baseline period. Canadian truck trips are close to normal, while daily truck trips in Mexico continue to drop, down 11%.
> Learn more about the DAT One load board network
Spot van rates
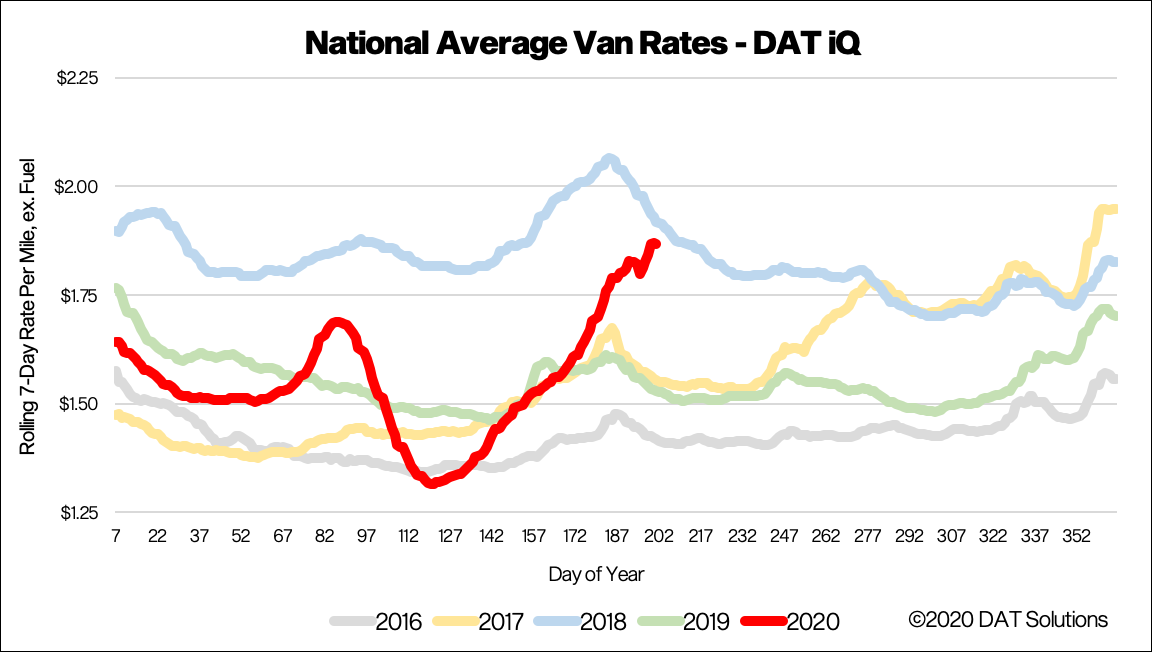
National average dry van spot rates continued to climb, reaching $1.87/mile excluding fuel, which is an increase of 4 cents per mile w/w and only 5 cents lower than the same week in 2018. This goes against the normal trend for this time of the year, when we typically see spot rates fall as demand decreases.
We still believe the dislocation of supply chains caused by the pandemic and ongoing network imbalances are driving the demand in the spot market. Our Ratecast model expects dry van rates to drop back to $1.83/mile in the next month.
> Learn more about freight rate tools from DAT iQ
Spot rate forecasts
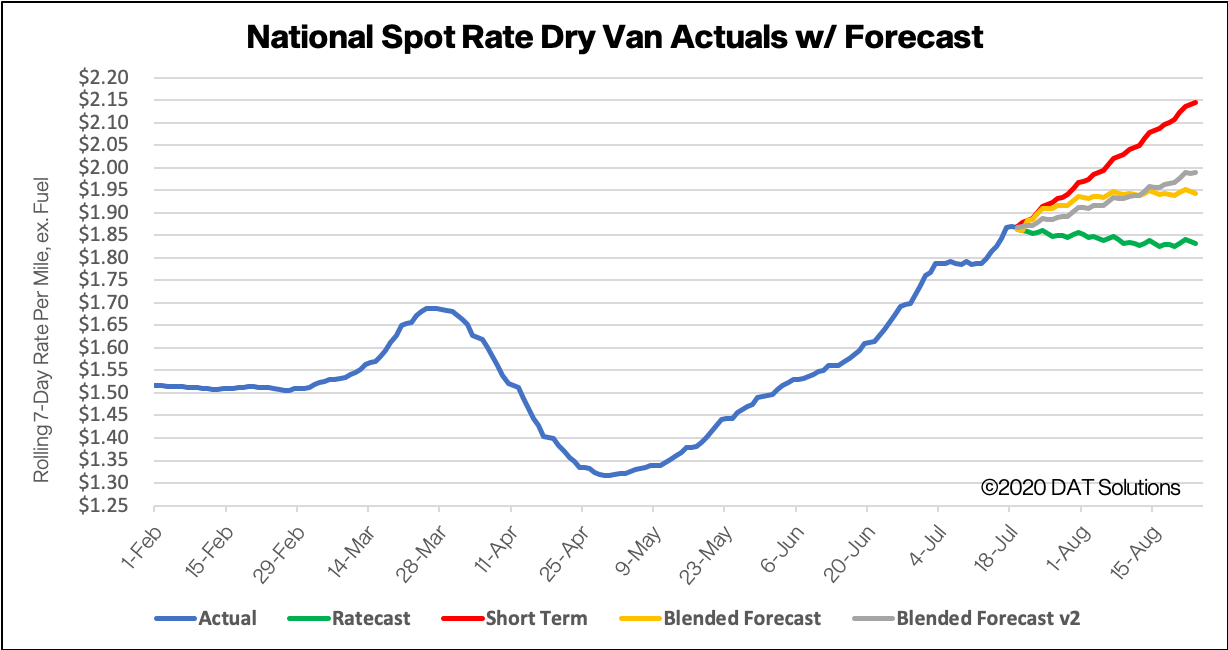
Forecasting during this volatile period is difficult. Our team is working diligently to update and adjust the models, but new information becomes available at a rapid pace. DAT would typically not publish these types of preliminary studies, but we feel that the benefit of sharing our observations far outweighs the risk. We ask that you please treat these statements and exhibits as directional and consider them as a variable in your own analyses.
How to interpret the rate forecast
- Ratecast Prediction: DAT’s core forecasting model
- Short Term Scenario: Formerly the pessimistic model that focuses on a more near-term historical dataset.
- Blended Scenario: More heavily weighted towards the longer-term models.
- Blended Scenario v2: More heavily weighted towards the shorter-term models.
> Learn more about rate forecasts from DAT iQ
Reefer trends
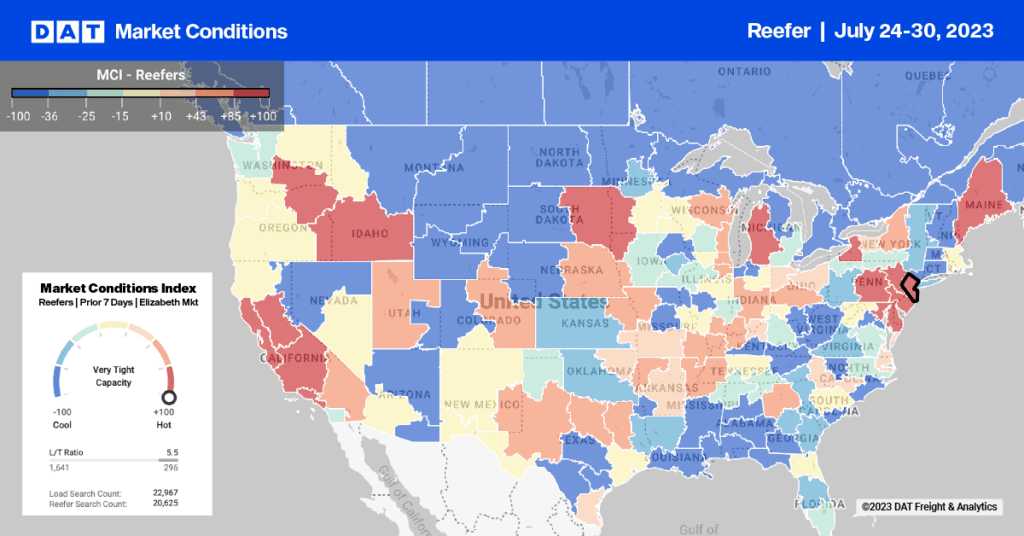
Market Condition Index (MCI)
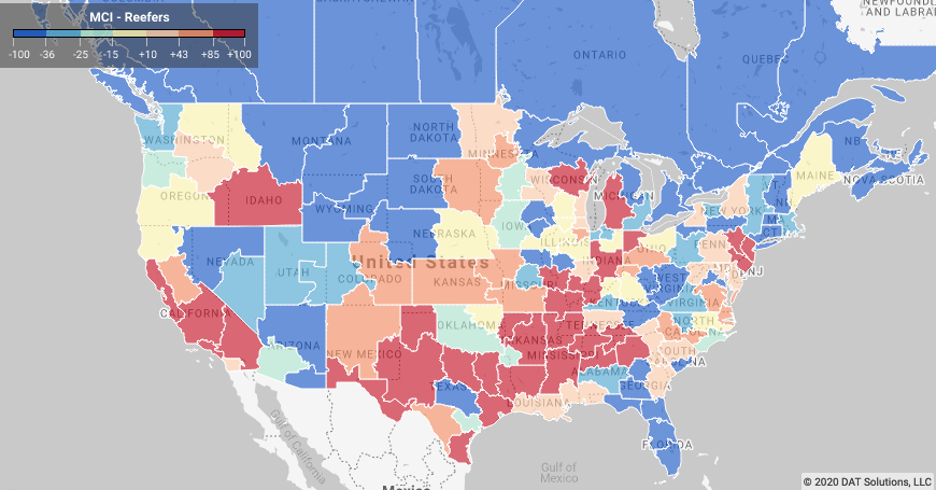
As we move into the hottest time of the year, it’s no surprise that demand for refrigerated equipment has also heated up in many freight markets. A record-breaking heat wave has swept across the United States in the last week. The National Oceanic and Atmospheric Administration also says 2020 is on pace to be one of the three hottest years on record globally, which may keep demand for reefers elevated for shippers who normally rely on cooler temperatures to ship freight in dry vans.
This week, USDA reported that seasonal year-over-year volumes of produce are down 13% for domestic and 2% for imported truckload shipments, which is close to 5,000 fewer loads compared to the same period in 2019. A shortage of trucks for melons was reported in Southwest Indiana, Southeast Illinois, and Southeast Missouri. A slight shortage of trucks was also reported for sweet potatoes from Eastern North Carolina, onions from Southern New Mexico, and melons and tomatoes from South Carolina.
Reefer freight for pears, cherries, peaches, apricots and potatoes out of the Pacific Northwest markets of Spokane and Medford remain strong, with load volumes increasing 2.51% and 22.34% w/w respectively. Load posts out of the Spokane market are up 36% m/m,with most loads destined for Eau Claire, WI, and Houston. Spot rates were also up slightly last week to $2.05/mile after hovering around this level since the end of June.
> Learn more about the Market Conditions Index
Load to truck ratio
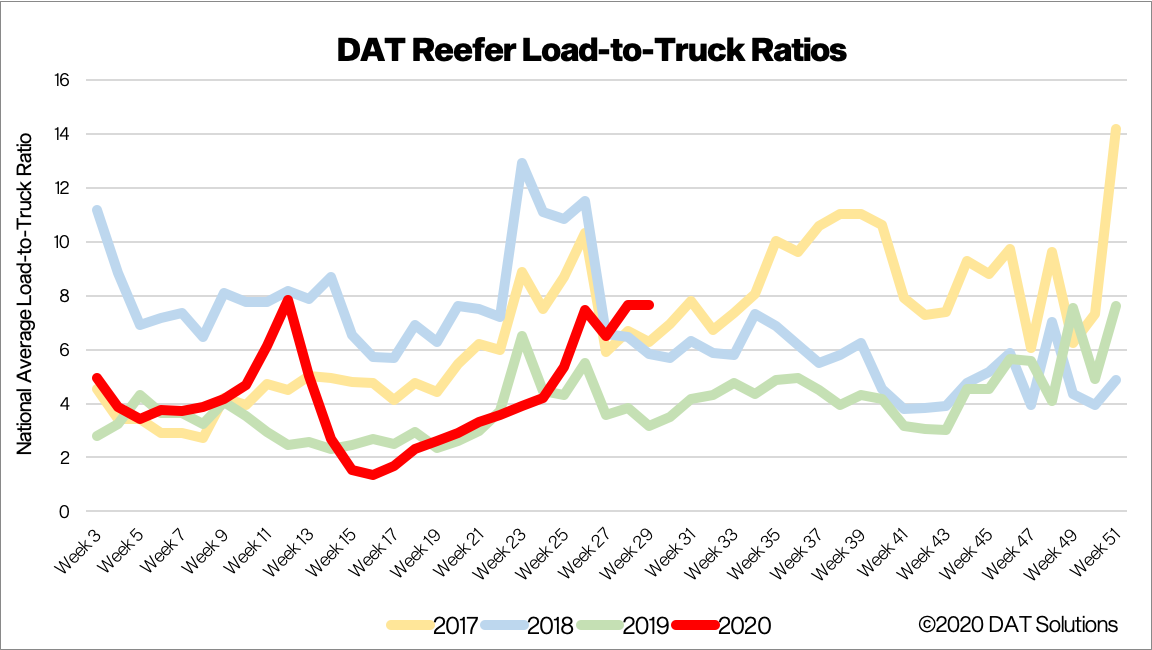
After remaining flat for the previous four weeks, the reefer LTR dropped last week by 8% to 7 loads per truck, which is up 50% compared to last year.
Of note is a further loosening of capacity, as 6% more trucks posted on the DAT One network last week – a trend we’ve been observing for the last four weeks. The number of reefer loads being posted also dropped 3%.
> Learn more about the DAT One load board network
Spot reefer rates
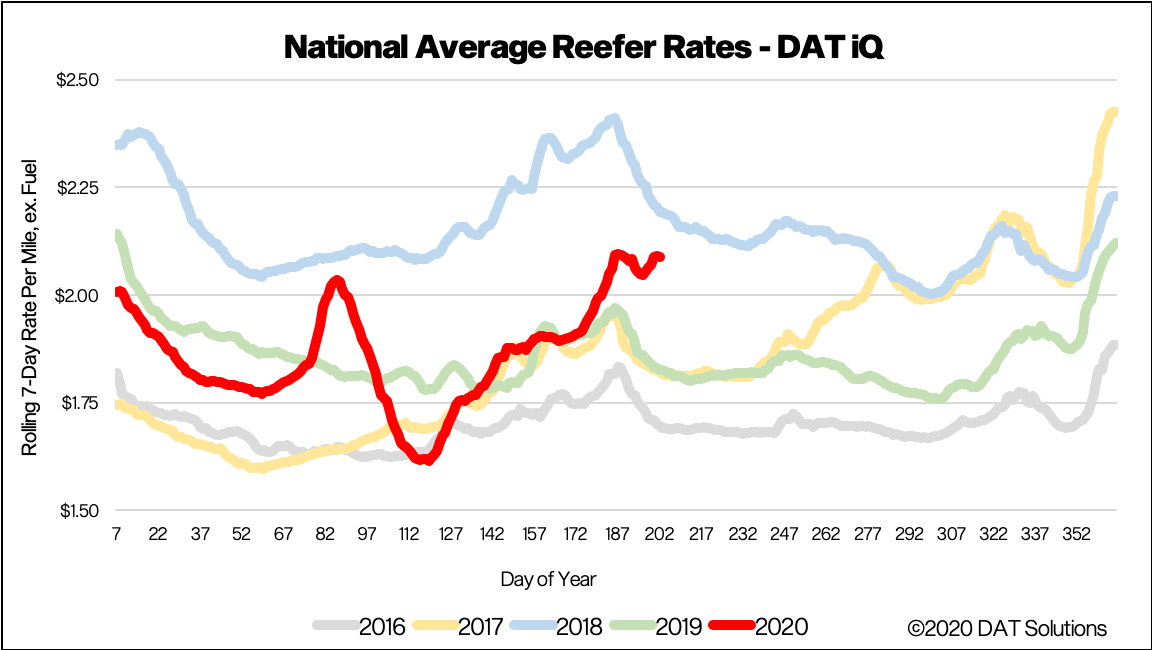
National average reefer rates went against normal seasonal trends by increasing another 4 cents last week to $2.09/mile, which is 13% higher than last year. Record-level temperatures and produce season should keep reefer carriers busy in the short-term, as spot rates sit just 10 cents below this time in 2018 when capacity was extremely tight.
Most indicators point to capacity increasing, which suggests the rise in spot rates is being driven by pandemic-related supply chain disruptions rather than a shortage in available capacity. Our Ratecast model expects reefer rates to plateau from now through mid-August around the current $2.09/mile level.
> Learn more about freight rate tools from DAT iQ
Reefer forecasts
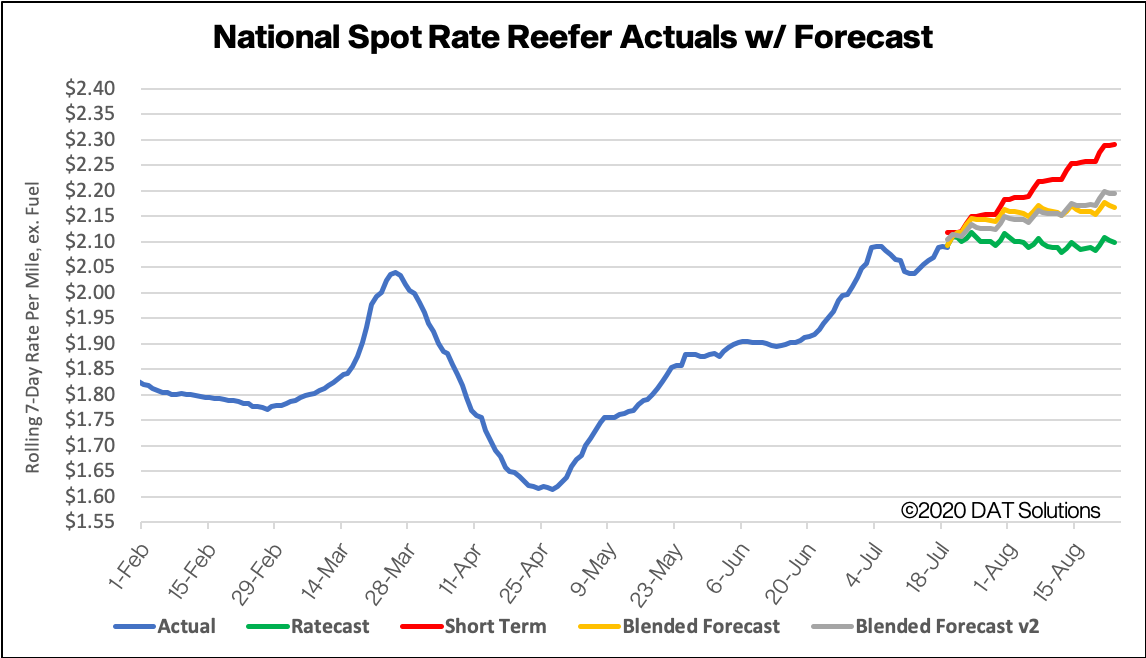
How to interpret the rate forecast
- Ratecast Prediction: DAT’s core forecasting model
- Short Term Scenario: Formerly the pessimistic model that focuses on a more near-term historical dataset.
- Blended Scenario: More heavily weighted towards the longer-term models.
- Blended Scenario v2: More heavily weighted towards the shorter-term models.
> Learn more about rate forecasts from DAT iQ
Flatbed trends
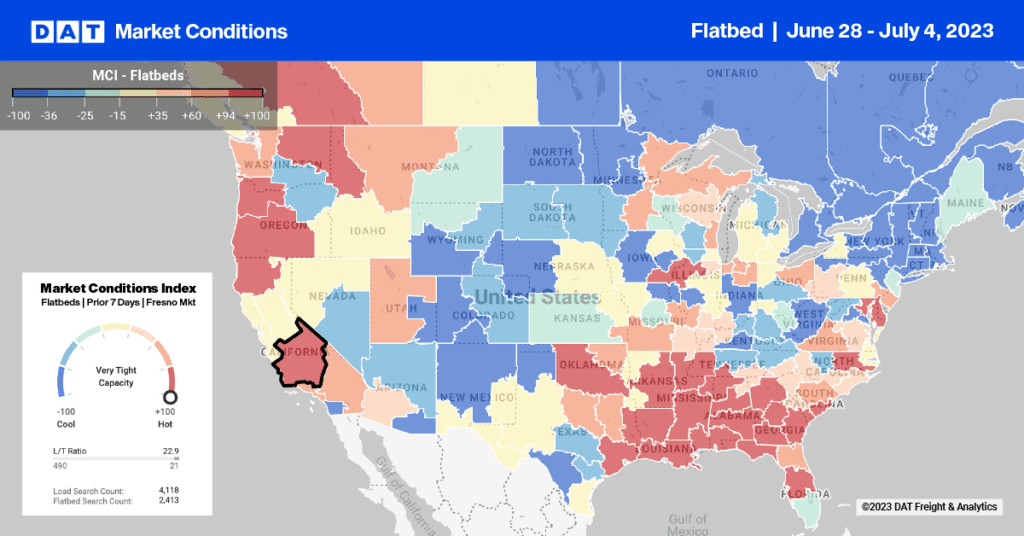
Market Condition Index (MCI)
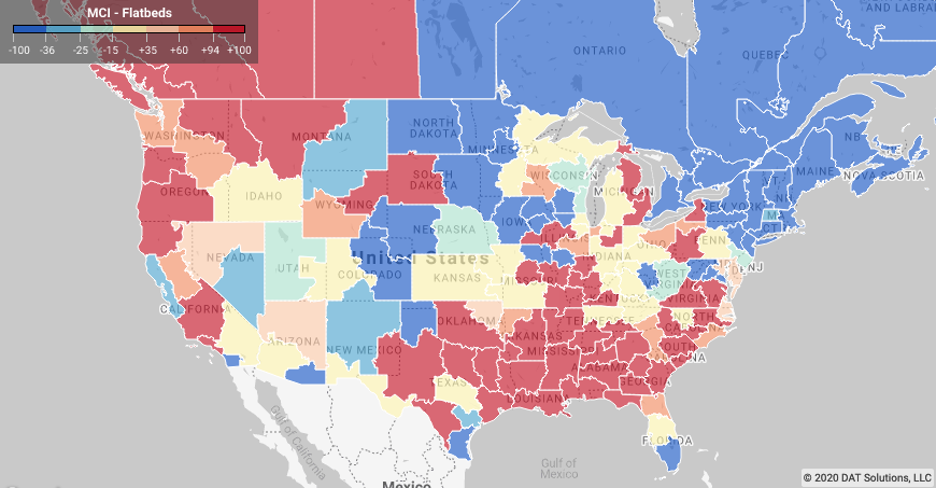 U.S. Industrial Production reported by the federal reserved increased 5.4% in June, the second straight month for improvement and a positive sign for economic recovery in manufacturing. The U.S. Census Bureau reported new home construction jumped 17.3% in June, and applications for new permits increased by 2.1%, another good indication of future building activity.
Home builders also reported stronger confidence in a post-COVID recovery based on the National Association of Home Builders (NAHB) Housing Market Index (HMI), which jumped 14 points to 72 for new single-family homes. The HMI is a diffusion index, which means that a reading above 50 indicates a favorable outlook on home sales and a reading below 50 indicates a negative outlook.
The NAHB also reports that lumber prices are at a two-year high with the important story being the changing geography of housing demand towards new construction in lower density markets as people seek out larger homes and anticipate more flexibility for telework in the years ahead.
> Learn more about the Market Conditions Index
Load-to-truck ratio
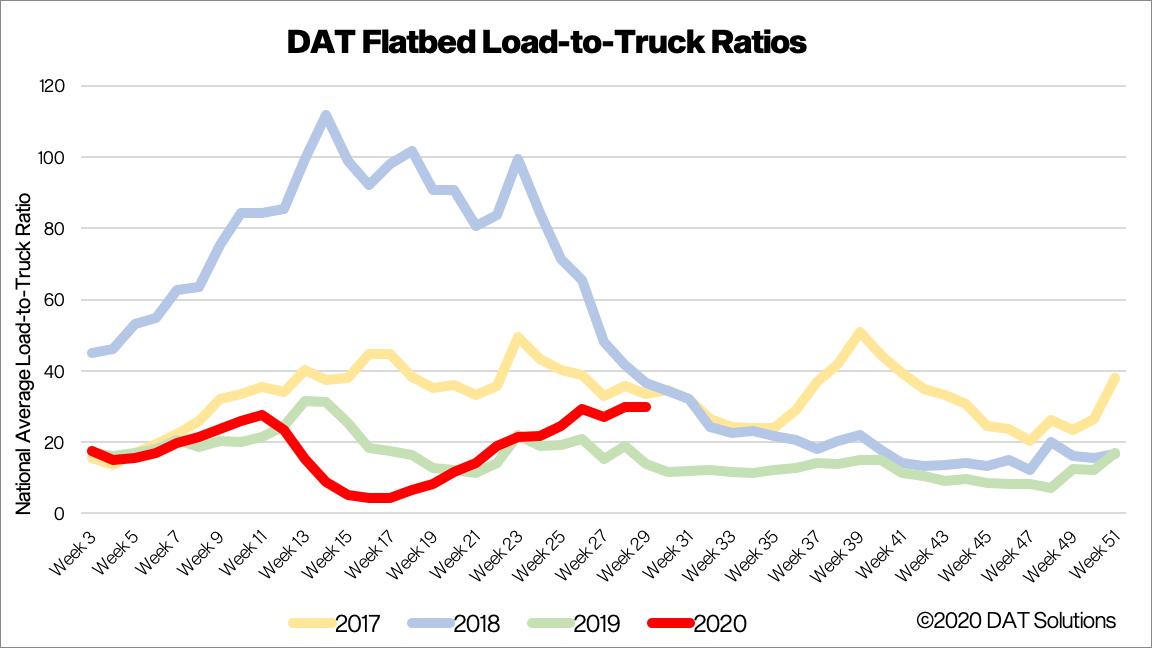
Both flatbed load posts and truck searches remained flat last week with less than 1% w/w change in both metrics. Increased activity in the building materials sector, driven largely by home improvement projects, has kept flatbed carriers busy with volumes more like 2017 and 2018, when the flatbed market was booming.
> Learn more about the DAT One load board network
Spot flatbed rates
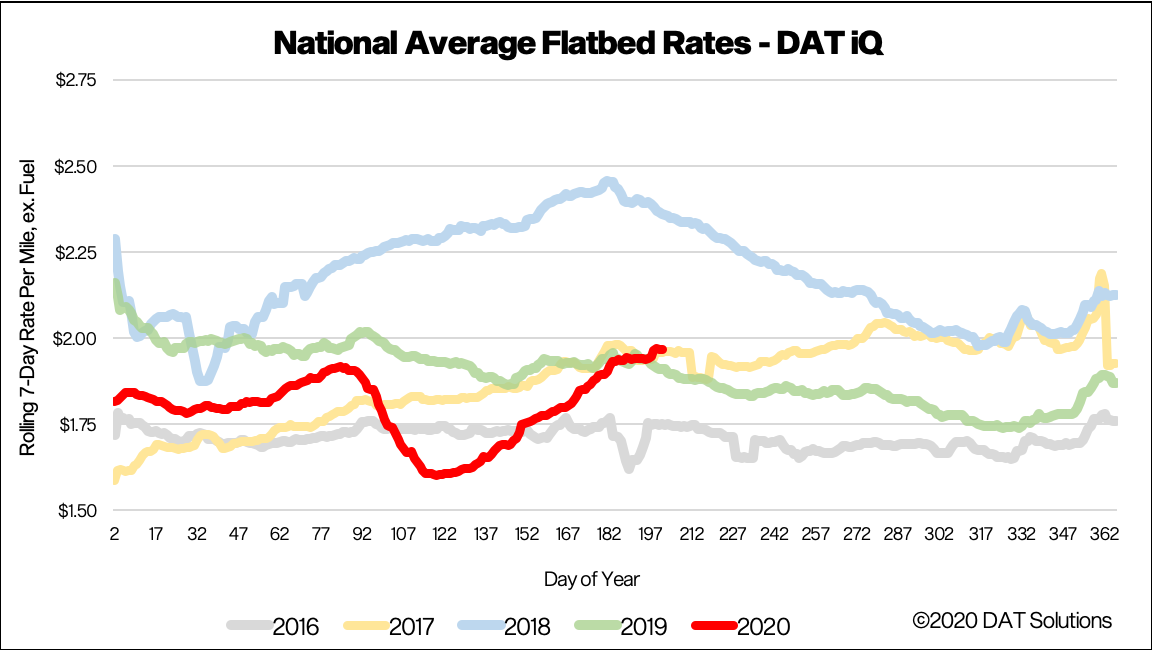
Flatbed spot rates are now slightly higher than they were in 2017 at $1.97/mile, but 39 cents lower than the same period in 2018, a time regarded by many as the peak in flatbed spot rates over the last five years.
Flatbed volumes out of the southern markets of Memphis, Little Rock, AR, and Fayetteville, AR, are up 13% w/w and 55% m/m, which has pushed rates up out of this region by 6%. Our Ratecast model expects flatbed rates to have peaked and decline by around 9 cents by mid-August.
> Learn more about freight rate tools from DAT iQ
Spot rate forecasts
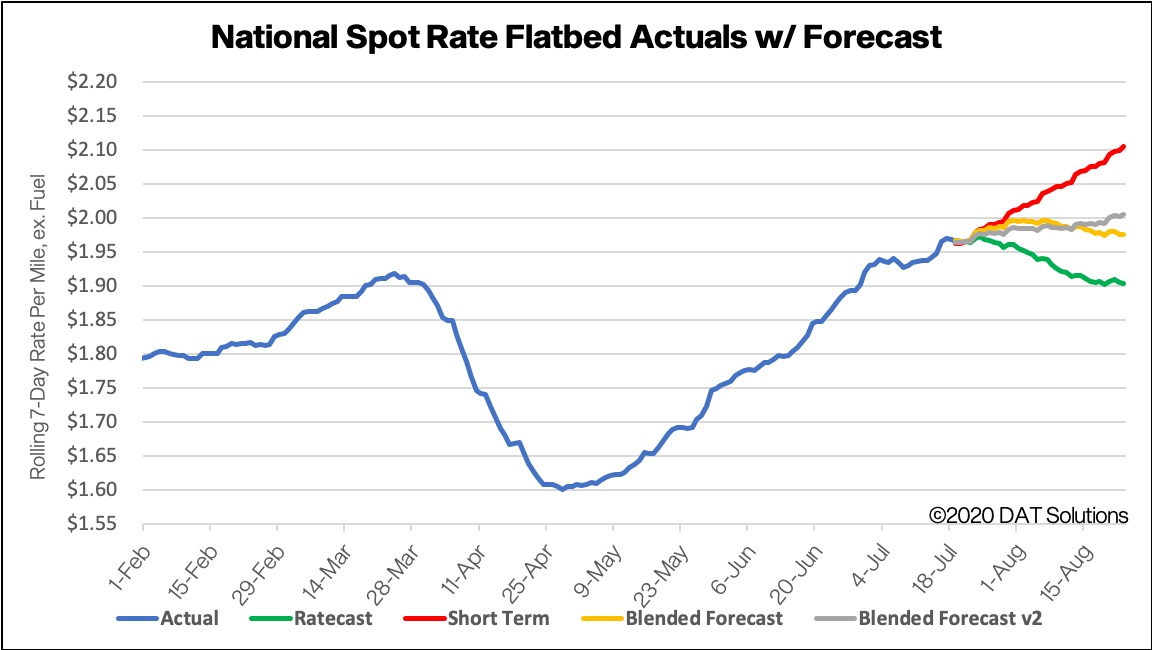
How to interpret the rate forecast
- Ratecast Prediction: DAT’s core forecasting model
- Short Term Scenario: Formerly the pessimistic model that focuses on a more near-term historical dataset.
- Blended Scenario: More heavily weighted towards the longer-term models.
- Blended Scenario v2: More heavily weighted towards the shorter-term models.
> Learn more about rate forecasts from DAT iQ
Need more information?
Our update will be refreshed next week, or sooner if conditions change materially. Any questions on this report or market conditions can be emailed to askIQ@dat.com.
We are also making available, free of charge, the DAT Daily 50 which is a daily report of the top 50 lanes by volume with a week’s worth of history and predictions using the Ratecast model.